Market Profile (TPO)
Market Profile organizes a session’s trade into Time Price Opportunities (TPOs): the session is split into fixed-length time periods (one letter each), and every price a period traded at earns that letter. Stacking the letters sideways draws a distribution that shows where the market spent its time - the fat middle is acceptance, the thin edges are rejection.
It is two pieces: computeMarketProfile (pure analytics, in the profile tier) and the
MarketProfile primitive that renders the result on the chart.
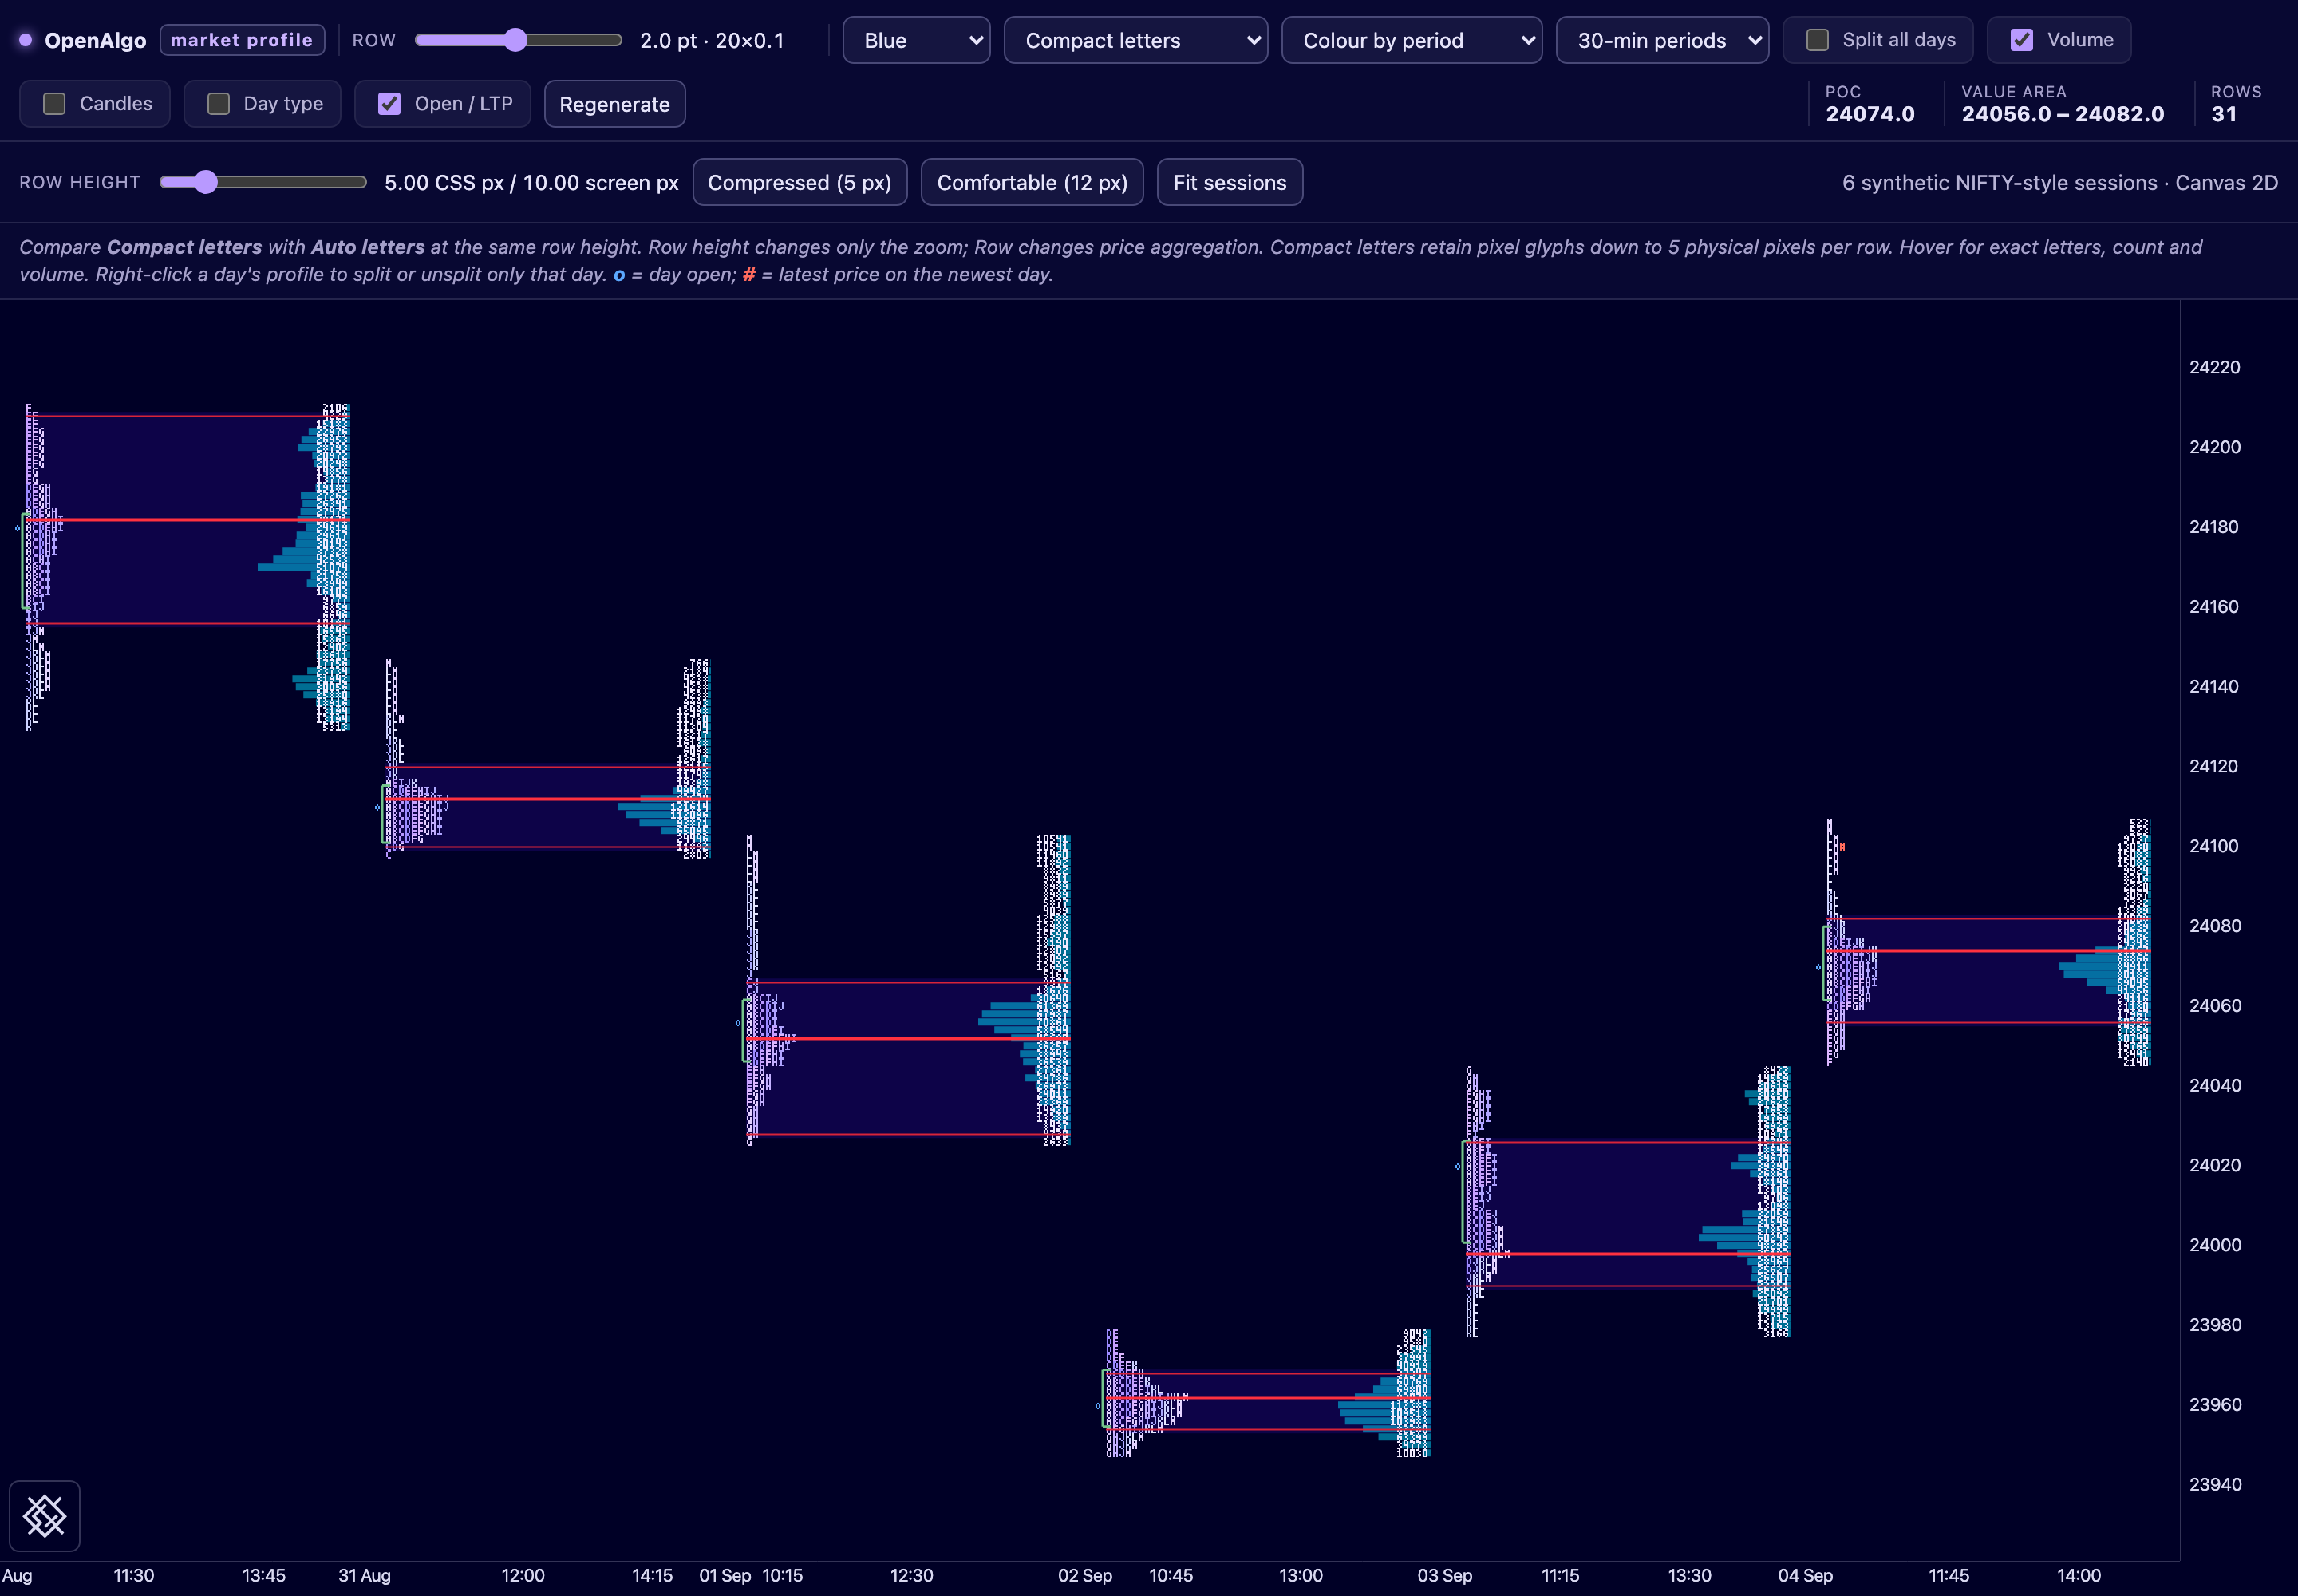
Since 2.1.0, compact pixel letters, individual split/unsplit controls and
open/latest-price markers are available. Select blockDisplay: 'compact' to use
the compact renderer; the library default remains 'auto'.
Open the interactive demo to change themes and split a day.
import { computeMarketProfile, MarketProfile } from 'openalgo-charts/profile';

const result = computeMarketProfile(bars, { tickSize: 0.05, session: 'day', blockMinutes: 30 });
chart.addPrimitive(new MarketProfile(result, { blockDisplay: 'compact' }));
Concepts
- Session - how bars are grouped into profiles:
day,week,month, orcomposite(one profile over everything). Grouping is by the calendar of thetimezoneoption, which defaults toAsia/Kolkata. Passchart.timezone()to make the profile and the axis agree. See Timezones. - Period / letter - each
blockMinutesslice of a session is one TPO letter (A,B, …Z, thena..z). - POC - Point of Control, the price with the most TPOs (the longest row).
- Value Area (VAH / VAL) - the band around the POC holding
valueAreaPercentof all TPOs. - Initial Balance - the price range of the opening
initialBalancePeriodsperiods. - Single prints - lone TPOs away from the extremes (quick moves that left a gap in time).
- Poor high / low - a session extreme printed by more than one TPO (a weak, often revisited, edge).
A profile in a few lines
The renderer overlays the price series, so add a price series first (it provides the time axis). Here is a composite profile - one distribution over all the bars, letters packed from the left. The synthetic bars use 0.1 ticks and two ticks per row (0.2-point rows); the candle series supplies the time axis and is hidden for clarity:
View example code
const chart = lib.createChart(el);
const bars = lib.generateBars(1700000000, 26, 1800); // 30-min bars
chart.addSeries('candlestick', { style: { visible: false } }).setData(bars);

const mp = lib.computeMarketProfile(bars, { tickSize: 0.1, rowTicks: 2, session: 'composite', blockMinutes: 30 });
chart.addPrimitive(new lib.MarketProfile(mp, {
blockDisplay: 'compact',
opacity: 1,
showSessionOpen: true,
showLastPrice: true,
showSinglePrints: false,
}));

chart.timeScale.fitContent(bars.length);
return chart;
Sessions
Switch session to split the same bars into one profile per day / week / month. Each
session’s profile is drawn under its own bars, so you can read structure across time:
View example code
const chart = lib.createChart(el);
const bars = lib.generateBars(1700000000, 120, 1800);
chart.addSeries('candlestick', { style: { visible: false } }).setData(bars);

const mp = lib.computeMarketProfile(bars, { tickSize: 0.1, rowTicks: 2, session: 'day', blockMinutes: 60, valueAreaPercent: 0.7 });
chart.addPrimitive(new lib.MarketProfile(mp, {
blockDisplay: 'compact',
opacity: 1,
showSessionOpen: true,
showLastPrice: true,
showSinglePrints: false,
})); // IB bracket on the left of each session

chart.timeScale.fitContent(bars.length);
return chart;
Color modes & volume sub-profile
colorMode is period (the default), valueArea, uniform, or the two heat modes
count and volume, where opacity scales with the row’s TPO count or volume. Use
blockDisplay to swap letters for solid blocks, and overlay a volume-at-price
sub-profile. This example deliberately uses 'blocks' to compare heat colouring
with the compact letter examples above:
View example code
const chart = lib.createChart(el);
const bars = lib.generateBars(1700000000, 40, 1800);
chart.addSeries('candlestick').setData(bars);

const mp = lib.computeMarketProfile(bars, { tickSize: 1, session: 'composite', blockMinutes: 30 });
chart.addPrimitive(new lib.MarketProfile(mp, {
colorMode: 'count',        // heat: opacity scales with TPO count
blockDisplay: 'blocks',    // solid blocks instead of letters
showVolumeProfile: true,   // volume-at-price on the right edge
volumeProfileWidth: 70,
}));

chart.timeScale.fitContent(bars.length);
return chart;
Theme screenshots
These browser captures use the same synthetic session and themes as the interactive demo. They are zoomed close-ups: 18 CSS pixels per row and 16-pixel letters at double resolution. Compact mode uses regular text at this zoom; the overview above shows its compressed pixel glyphs. Click a screenshot to inspect its original resolution.
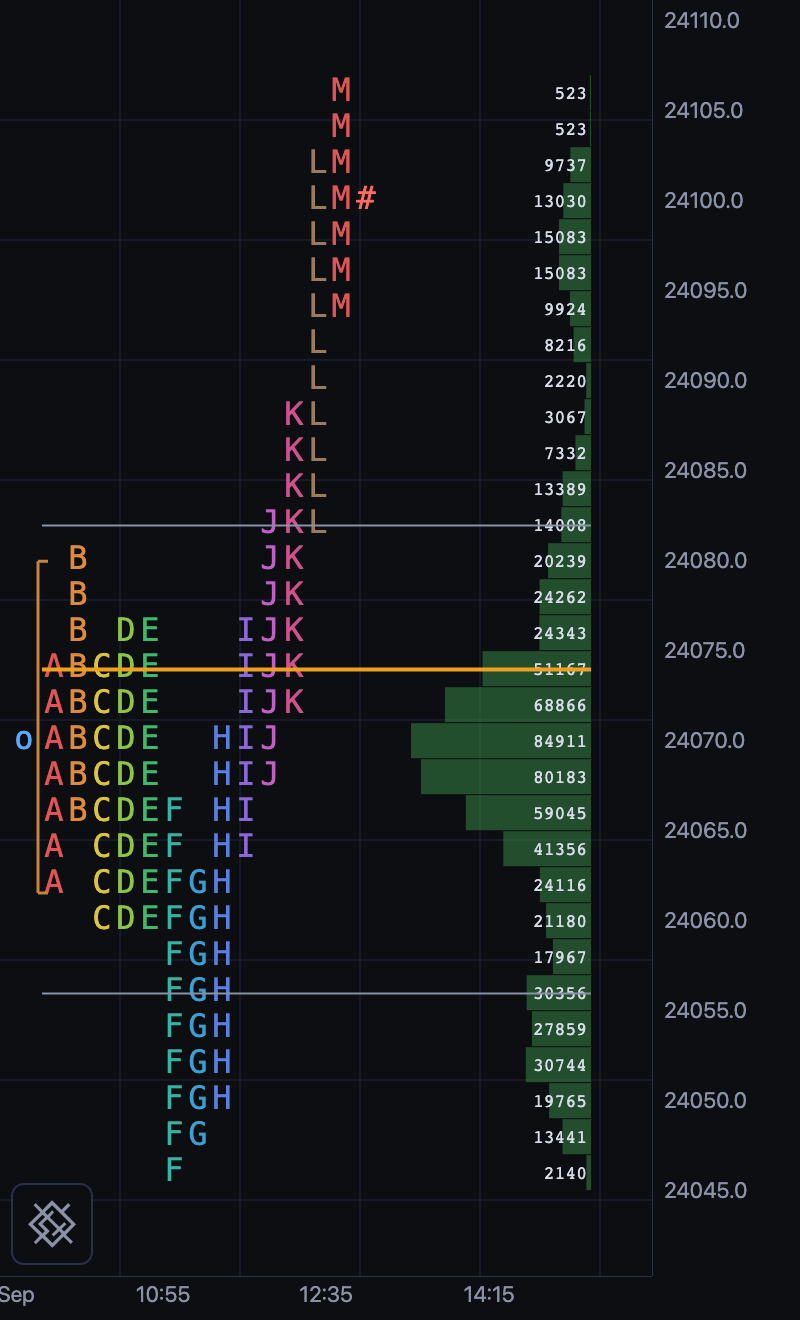
Multicolour periods on a dark background.
Try Dark ↗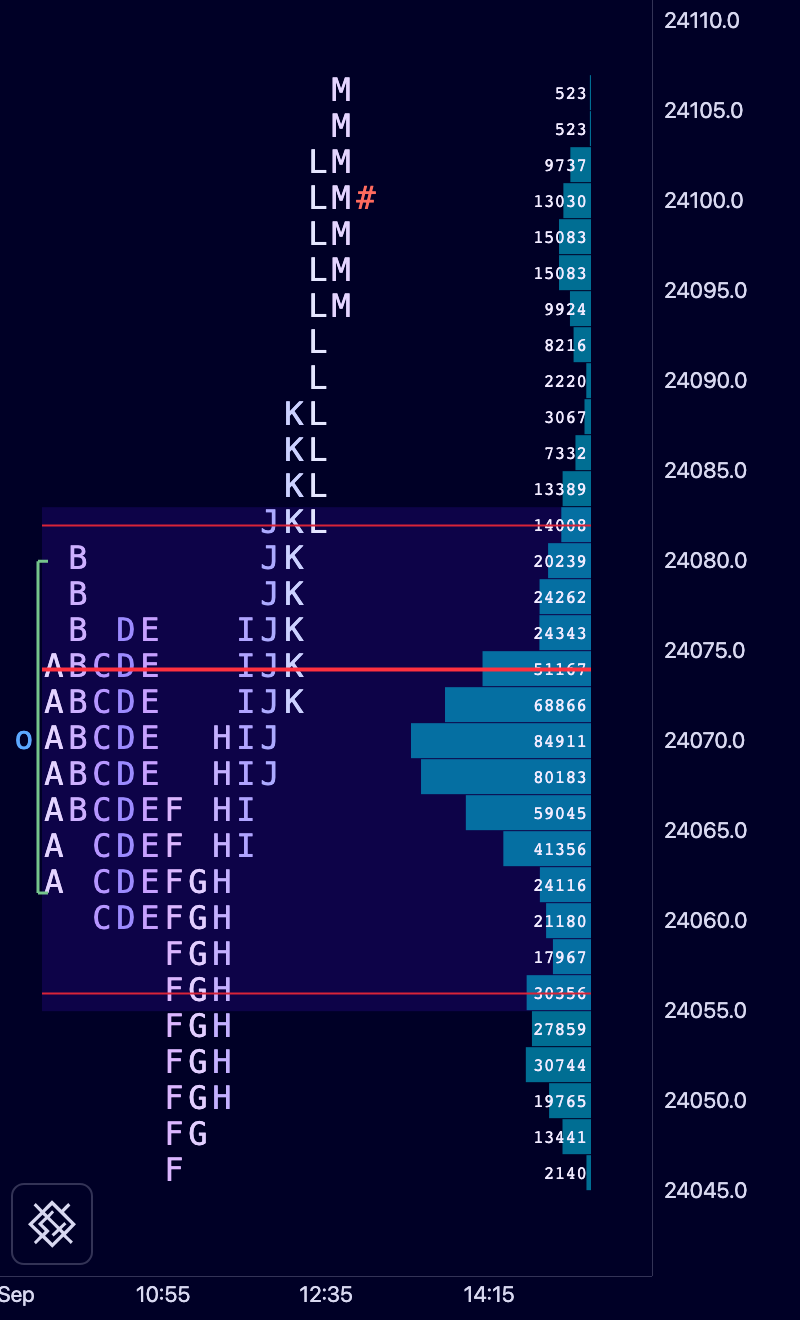
Navy background, purple letters and cyan volume.
Try Blue ↗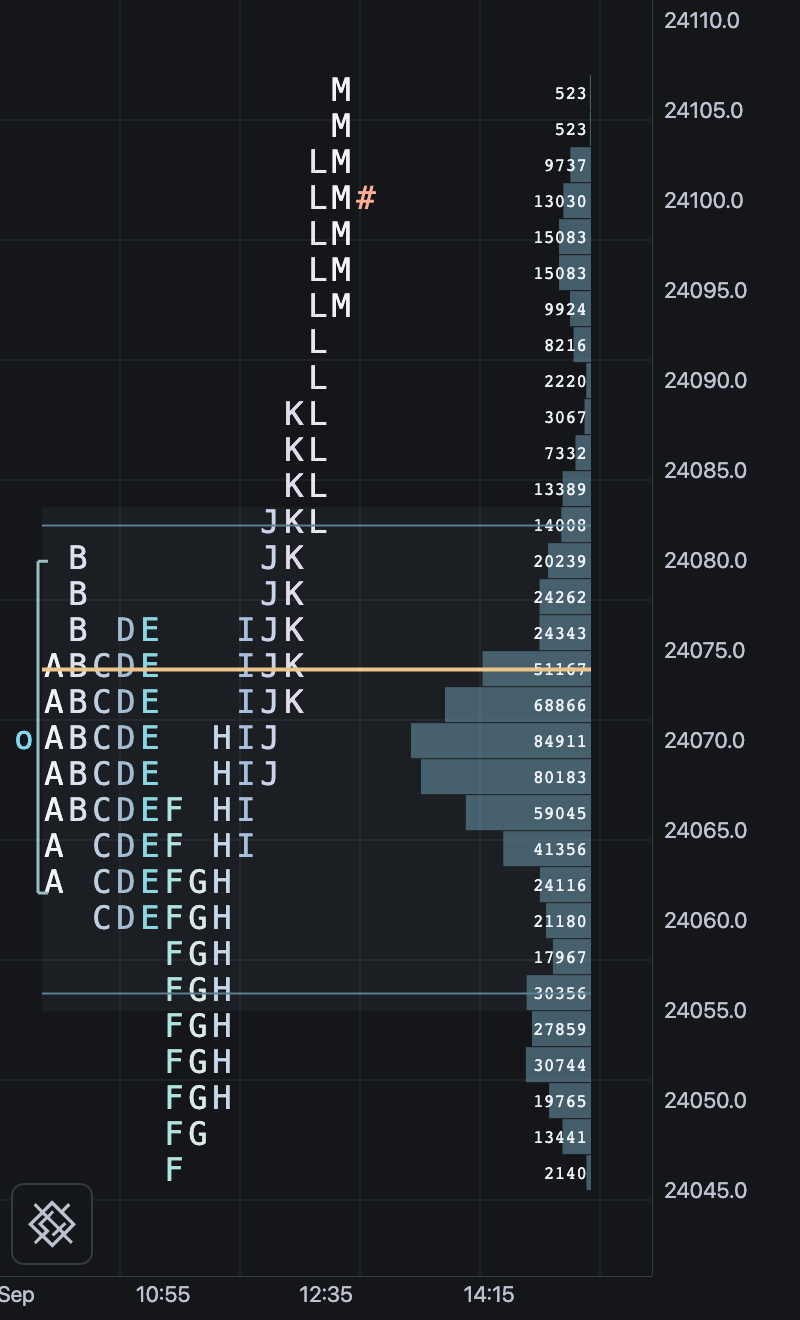
Charcoal, pale letters and muted cyan volume.
Try Graphite ↗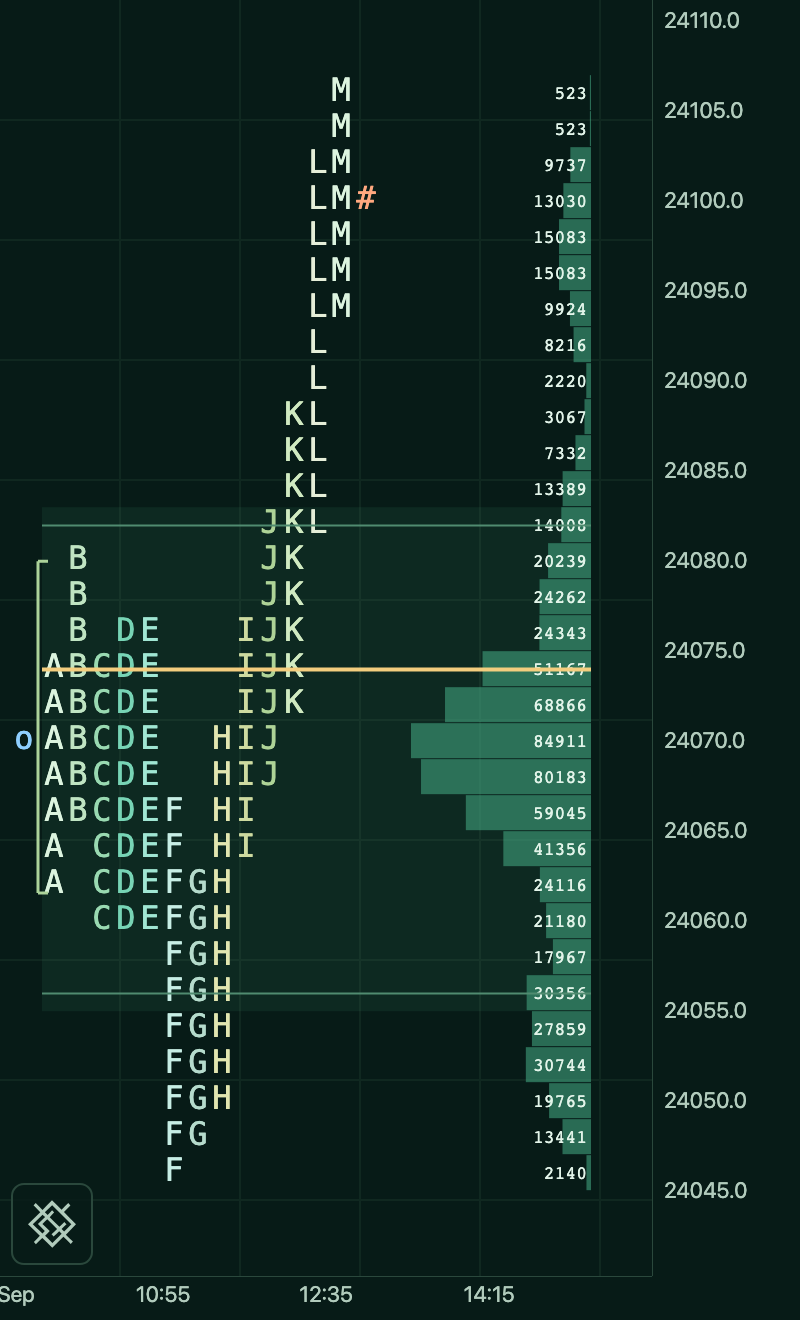
Deep green, mint letters and gold reference lines.
Try Emerald ↗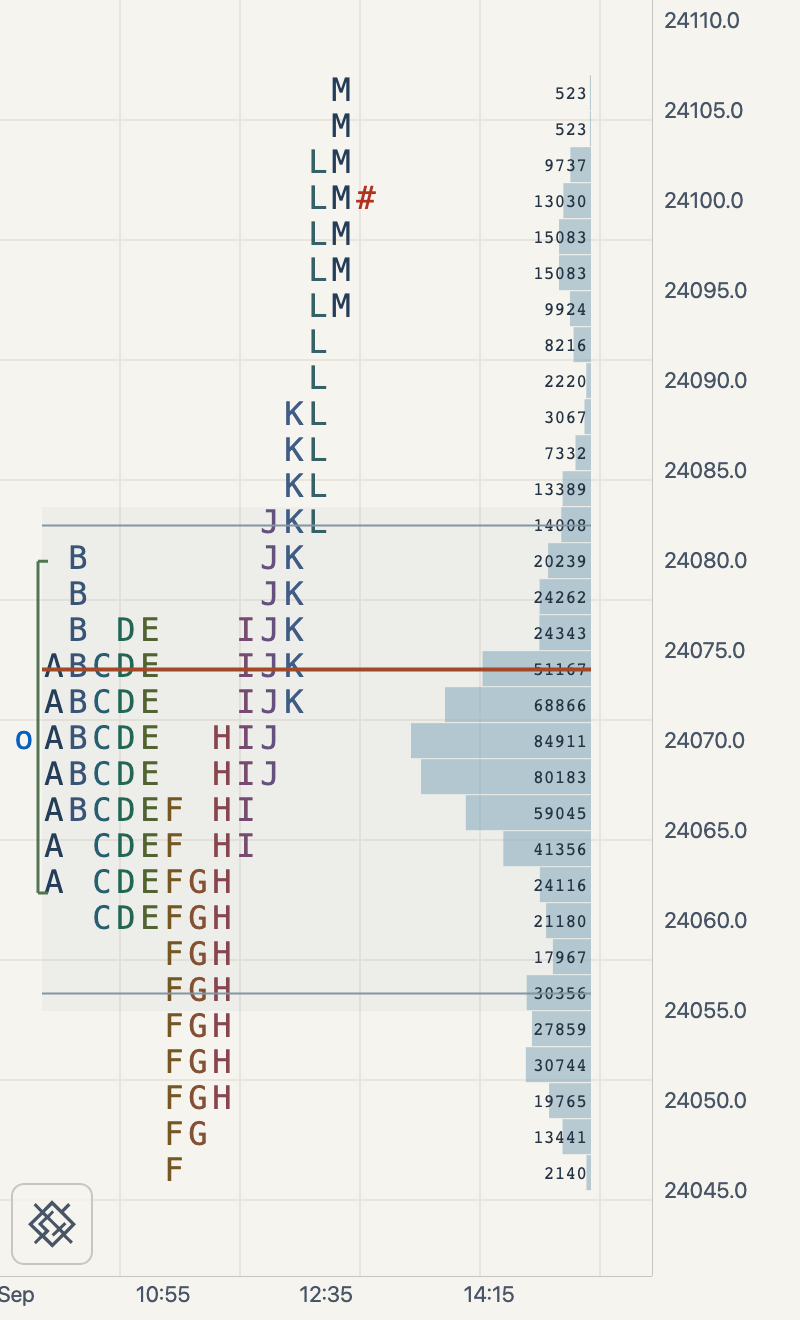
Warm light background, dark letters and blue-grey volume.
Try Ivory ↗See packed and split views for the same session before and after splitting.
computeMarketProfile options
computeMarketProfile(bars, options): MarketProfileResult| Option | Default | Description |
|---|---|---|
tickSize | 0.05 | the instrument’s real tick |
rowTicks | 1 | ticks per TPO row (see Row size) |
session | 'day' | 'day' / 'week' / 'month' / 'composite' |
blockMinutes | 30 | period length (one letter per period) |
valueAreaPercent | 0.7 | fraction of TPOs inside the value area (0..1) |
initialBalancePeriods | 2 | opening periods that form the Initial Balance |
window | none | restrict each session to a SessionWindow; see Sessions |
timezone | 'Asia/Kolkata' | IANA zone the session / day / week / month calendar resolves on; a window naming its own zone overrides it. See Timezones |
compositeSessions | 1 | merge N consecutive sessions into one profile |
tailEdges | 0 | min run of single prints that promotes a buying / selling tail |
Row size
TPO row height is tickSize * rowTicks. Keeping the two separate means widening rows never
means lying about the instrument’s tick, which matters because the tick is what imbalance
and single-print logic are counted on.
rowTicks is the multiplier a trader already thinks in. Nifty trades in 0.1 and you want
2-point rows, so the multiplier is 2 / 0.1 = 20:
computeMarketProfile(bars, { tickSize: 0.1, rowTicks: 20 });      // 2-point rows
computeMarketProfile(bars, { tickSize: 0.1, rowTicks: rowTicksFor(2, 0.1) });  // same thing
rowTicksFor(rowSize, tickSize) does the division for you and floors at 1.
The order flow / footprint side takes the same multiplier, so a chart’s bricks and its
profile rows can share one grid: computeFootprint(time, trades, 0.1, 20) and
new FootprintAggregator(tf, 0.1, 20). See Profiles & Order Flow.
Session windows
A window drops bars outside a trading session and anchors period A to the window’s open,
not to whatever bar happened to arrive first, which otherwise shifts every letter. Windows
that cross midnight are handled as one session, not two halves.
import { computeMarketProfile, TRADING_HOURS } from 'openalgo-charts/profile';

computeMarketProfile(bars, { window: TRADING_HOURS['india'] });       // 09:15-15:30 Asia/Kolkata
computeMarketProfile(bars, { window: TRADING_HOURS['us-regular'] });  // 09:30-16:00 America/New_York

// A hand-written window is minutes from midnight on the profile's `timezone`.
computeMarketProfile(bars, {
  timezone: 'America/New_York',
  window: { startMinute: 9 * 60 + 30, endMinute: 16 * 60, name: 'RTH' },
});
Built-ins: all-hours, india, asia, london, new-york, us-regular. Each preset
carries the zone its numbers are written in, so us-regular reads as 09:30-16:00
America/New_York and follows EST/EDT instead of freezing at whatever offset New York had
when the table was written. A window’s own zone wins over the profile’s timezone for
both the window test and the day/week/month grouping, so a preset selects the same real
instants whichever zone the chart is displayed on. See Timezones.
MarketProfile primitive options
Pass in the constructor (new MarketProfile(result, options)) or update live with
profile.setOptions({ ... }).
| Option | Default | Description |
|---|---|---|
blockDisplay | 'auto' | auto / compact / blocks+letters / letters / blocks (see Letters and bricks) |
minLetterHeight / letterFade | 7 / 4 | row height (px) where letters give way to bricks, and the fade band |
letterWidth | 8 | width of one TPO column, px |
font | 10 | letter font size, px (auto-shrinks to fit short rows) |
colorMode | 'period' | period / valueArea / count / volume / uniform |
periodColors | 12 hues | palette for colorMode: 'period' |
opacity / outsideVaOpacity | 0.92 / 0.45 | block opacity, and dimming outside the value area |
split | false | give each period its own column slot instead of packing rows left |
showSessionOpen / sessionOpenColor | false / blue | lowercase o at each session’s opening-price row |
showLastPrice / lastPriceColor | false / coral | # at the newest supplied session’s latest close; no marker on older sessions |
profileSpacing | 4 | gap between session profiles, px |
showPoc / pocColor / pocThickness / showPocLabel | true / gold / 2 / true | Point of Control |
showValueArea / vahColor / valColor / showValueAreaLabels | true | VAH & VAL lines + labels |
fillValueArea / valueAreaFillColor / valueAreaFillOpacity | true / teal / 0.07 | shade the value-area band |
showInitialBalance / ibColor | true | opening-range bracket |
showSinglePrints / singlePrintColor | true | mark lone TPOs |
showTails / buyTailColor / sellTailColor | true | buying / selling tails (needs tailEdges) |
showPoorHighLow / poorColor | false | flag a session extreme that printed more than one TPO |
showNakedLevels / nakedColor | false | extend untested prior POC / VAH / VAL to the right edge |
showDevelopingPoc / showDevelopingVa | false | trace POC / value area as they developed |
showTpoCounts / countColor | false | per-level TPO count column |
showSessionLabel / showDayType / showOpenType | true / false / false | header labels |
showVolumeProfile / volumeProfileWidth / volumeProfileSide / showVolumeValues | false / 60 / right / false | volume-at-price sub-profile |
zOrder | top | draw over (top) or behind (bottom) the series |
Letters and bricks
A TPO row is only as tall as the price scale makes it, so at some zoom a letter stops fitting.
Rather than clip glyphs or make you toggle a setting, blockDisplay: 'auto' (the default)
crossfades: the block is always drawn, and the letter fades in over letterFade px above
minLetterHeight. Zooming through the threshold reads as one continuous change rather than a
jump, and the profile stays readable at every scale.
Pin the behaviour when you want it fixed: 'letters' for glyphs only, 'blocks' for a pure
brick profile, 'blocks+letters' to force both regardless of room.
For dense profiles, use blockDisplay: 'compact'. At short row heights it draws an
original 3×5 pixel alphabet, including distinct uppercase/lowercase TPO periods and volume
digits. Strokes align to physical screen pixels and scale by whole pixels, without automatic
letter fading or outside-value-area dimming. opacity still applies to TPO letters; their
colour still follows colorMode, including heat weighting when count or volume colouring
is explicitly selected. Column spacing contracts with the glyphs, capped by
letterWidth. At row heights of 12 CSS pixels and above, regular canvas text is used.
profile.setOptions({ blockDisplay: 'compact', opacity: 1, showVolumeValues: true });The pixel alphabet needs at least 5 physical pixels vertically and 3 horizontally.
Below that size TPOs remain as thin coloured marks and hoverAt still returns the exact
letters. Volume numbers are drawn only when the complete number fits. The mode changes
rendering only: it never merges price rows or recalculates the profile. It works with
Canvas 2D, screenshots and vector SVG export; enabling WebGL2 is not required.
SVG export evaluates the pixel threshold at its output dimensions (DPR 1). Increase
the export width and height to preserve the same small-row detail as a high-DPI screen.
The standalone demo at examples/market-profile/index.html compares compact and automatic
display modes while changing row height independently of price aggregation. Run
npm run build and node tests/e2e/serve.cjs, then open
http://127.0.0.1:4173/examples/market-profile/index.html.
The same demo is embedded on this website,
with a full-resolution theme gallery.
Its theme selector includes Dark, Blue (navy, purple and cyan),
Graphite (charcoal and muted cyan), Emerald (deep green and mint), and
Ivory (a warm light background with dark ink). Palettes style the chart,
profile, controls, tooltips and price markers together. Append ?theme=blue,
?theme=graphite, ?theme=emerald or ?theme=ivory to open a palette directly.
Single-print dashes are disabled in this demo (showSinglePrints: false); the
letters and hover information still identify those rows.
Split or unsplit one day
Use the session index from hoverAt to change just that profile:
profile.setSessionSplit(hit.sessionIndex, true);  // split this session
profile.setSessionSplit(hit.sessionIndex, false); // pack this session again
profile.isSessionSplit(hit.sessionIndex);        // effective current display
profile.setSessionSplit(hit.sessionIndex, null);  // restore the global default
setSessionSplit returns false for a missing session, otherwise true. Overrides
follow the session’s calendar identity when setData updates prices, rebuckets rows,
or prepends earlier history. They are scoped to the grouping, timezone and session
window. Other style changes preserve them. An explicit setOptions({ split: true })
or setOptions({ split: false }) clears all overrides and applies to every session.
The demo provides a right-click menu with Split this day / Unsplit this day and a Split all days checkbox. A mixed checkbox means only some days are split. These display choices never alter the profile’s letters, POC or value area.
Open and latest-price markers
profile.setOptions({ showSessionOpen: true, showLastPrice: true });Lowercase o is drawn beside the opening-price row of every session. # follows
the latest close on the newest supplied session only, including in split view.
Both use the model’s price-row rounding and stay visible as small pixel glyphs in
compressed views. Refresh the computed profile with setData as new bars or ticks
arrive to move #; enabling the marker does not subscribe to a market feed.
The standalone demo uses synthetic historical sessions, so its newest session
represents the current trading day for this demonstration.
The footprint renderer fades its cell numbers the same way, via minTextHeight / textFade.
Hit-testing
hitTest(x, y) and hoverAt(x, y) map a pointer back to the session and price row under it,
so a host can build a tooltip without the library owning any DOM. hoverAt returns
{ sessionIndex, price, level, session, isPoc, inValueArea, isSinglePrint }.
chart.on('crosshair:move', (e) => {
  const hit = e.point ? mp.hoverAt(e.point.x, e.point.y) : null;
  if (hit) tooltip.textContent = `${hit.level.letters}  ${hit.level.count} TPO`;
});
Data model
interface MarketProfileResult {
  sessions: MarketProfileSessionResult[];
  options: MarketProfileOptions;
}

interface MarketProfileSessionResult {
  startTime: number;      // UTC seconds (first bar)
  endTime: number;        // UTC seconds (last bar)
  levels: { price: number; count: number; letters: string; volume: number }[]; // high -> low
  poc: number;
  vah: number; val: number;
  periods: number;
  initialBalance: { high: number; low: number };
  singlePrints: number[];
  poorHigh: boolean; poorLow: boolean;
  totalVolume: number;
}
Everything you need for your own annotations (naked POCs, day-type labels, alerts) is on the result - the primitive is just one way to draw it.
Live updates
Recompute on new bars and hand the fresh result to the same primitive; setData repaints:
const profile = new MarketProfile(computeMarketProfile(bars, opts), { blockDisplay: 'compact' });
chart.addPrimitive(profile);

// later, as bars grow:
profile.setData(computeMarketProfile(bars, opts));
profile.setOptions({ colorMode: 'count' }); // restyle without recomputing
Volume-at-price here comes from each bar’s volume spread across its range - a fast
approximation. For true bid/ask volume distribution use the Footprint.
Troubleshooting
| Symptom | Cause | Fix |
|---|---|---|
| Nothing renders | No price series, so the time axis has no bars | Add a series (addSeries) before the profile |
| Only one profile for many days | session: 'composite' | Use session: 'day' (or week / month) |
| Letters are too small | Too many price rows for the chart height | Use blockDisplay: 'compact' or zoom vertically; increase rowTicks only when you intend to aggregate more ticks per row |
| Letters run past the session | Many periods and a wide letterWidth | Lower letterWidth, or raise blockMinutes |
| Value area looks wrong | valueAreaPercent not in 0..1 | Pass a fraction (0.7), not a percent (70) |