Profile demo & themes
Explore six daily profiles with compact TPO letters, volume values and independent split/unsplit controls. The demo uses synthetic data, with 2-point price rows and 30-minute periods. It does not connect to a live market feed.
These features have been available since 2.1.0. The embedded demo runs the library built with this website. See the release notes for the complete changes.
Try the demo
Right-click inside a day’s profile and choose Split this day. Right-click the same day again to Unsplit this day. Other sessions retain their display. Use Open full-size demo for more room to inspect the small letters.
| Control | What it changes |
|---|---|
| Theme | Chart, profile, controls, tooltip and marker colours |
| Compact letters | Pixel glyphs at short row heights; regular text when there is more room |
| Compressed / Comfortable | Row height of 5 / 12 CSS pixels, without changing the price rows |
| Row | Price aggregation: 20 ticks × 0.1 = 2 points in this demo |
| Right-click a profile | Split or unsplit only the selected day |
| Split all days | Apply one display to every session; a mixed checkbox means some are split |
| Open / LTP | Lowercase o for each day’s open; # only for the newest session’s latest close |
| Volume | Volume bars and values alongside each profile |
| Fit sessions | Fit the loaded data into the viewport |
Single-print dashes are off in this demo. Hovering still identifies single prints and reports the exact letters, count and volume at a row.
Compressed appearance
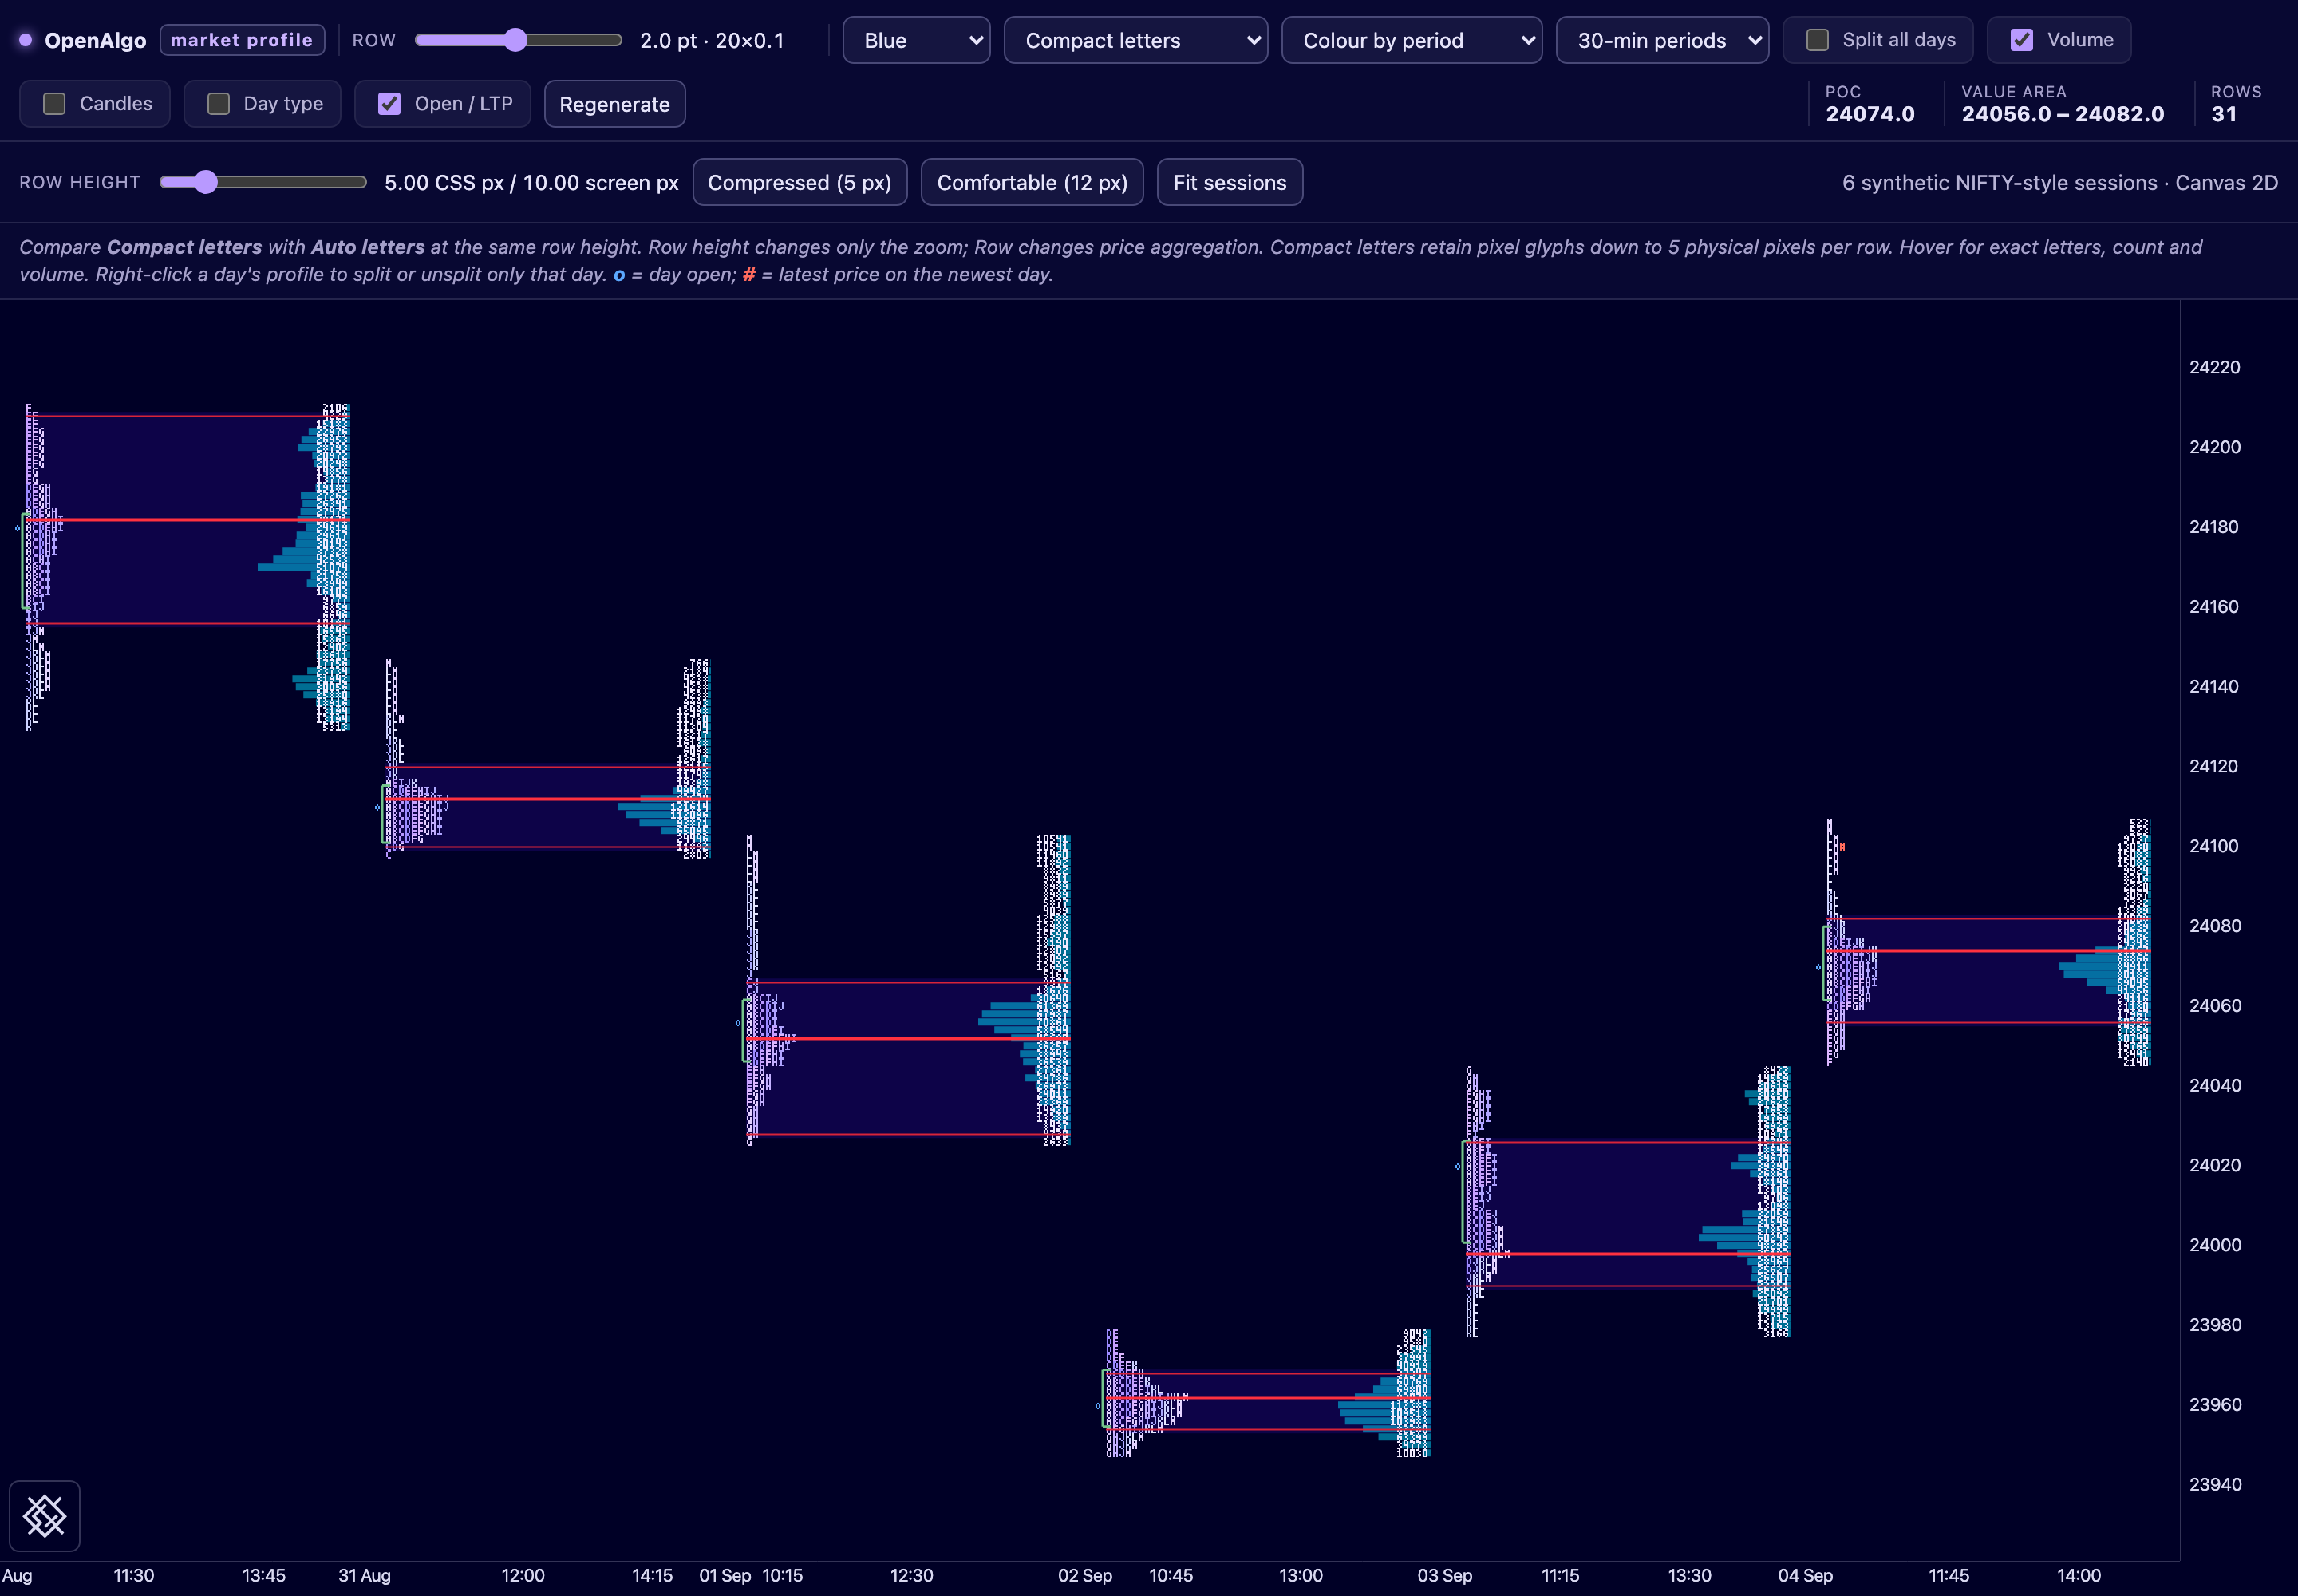
This browser screenshot captures the current local demo in Blue, with six packed sessions and the Compressed (5 px) control selected. The 2-point price rows and 30-minute periods are unchanged. Open the full-resolution image to inspect the compact pixel glyphs.
Five themes
Each image focuses on the same newest session, with 18-pixel rows and 16-pixel letters captured at double resolution. These are zoomed close-ups; compact mode uses regular text at this height, while the compressed view above uses pixel glyphs. The gallery keeps these close-ups large enough to read; on very narrow screens, scroll an image sideways to see the full chart. Click an image for the original, or use Try to test its theme and compressed row heights in the interactive demo.
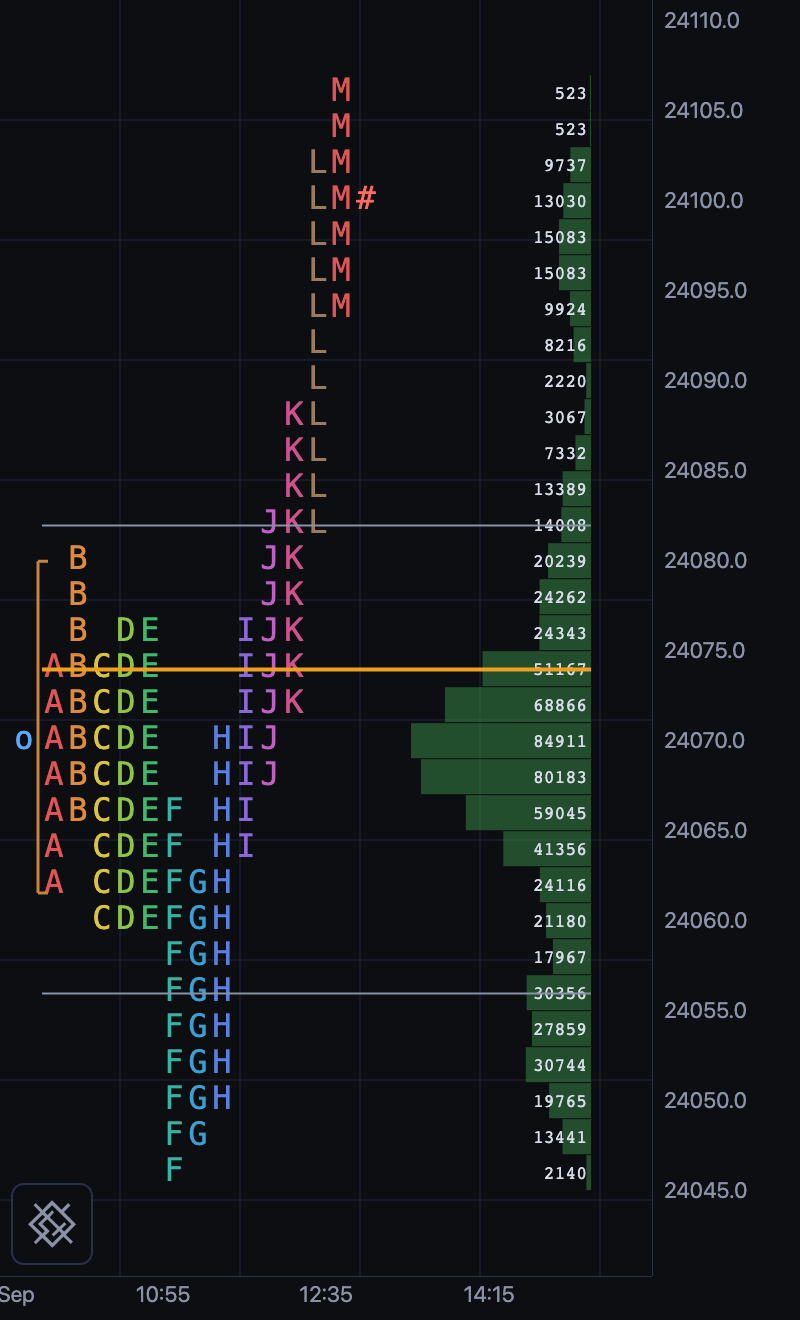
Multicolour periods on a dark background.
Try Dark ↗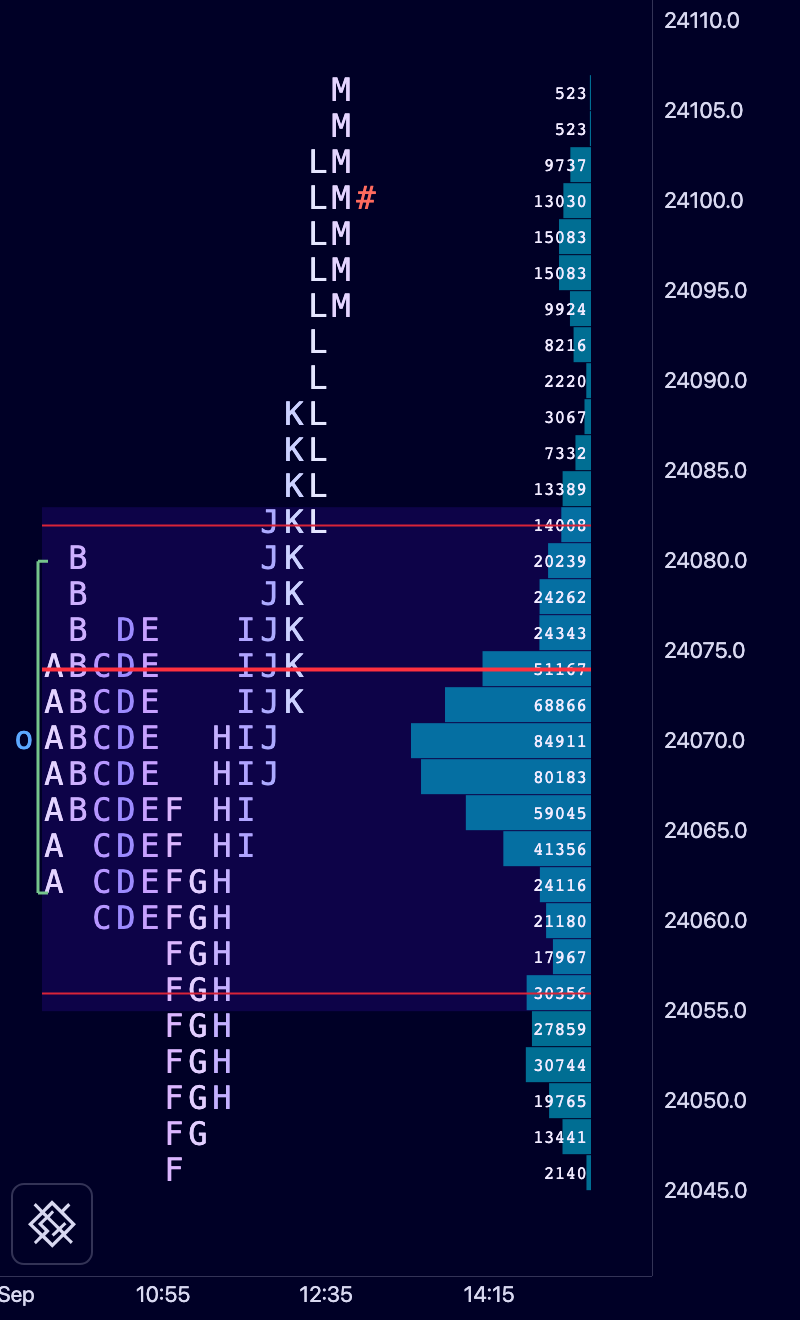
Navy background, purple letters and cyan volume.
Try Blue ↗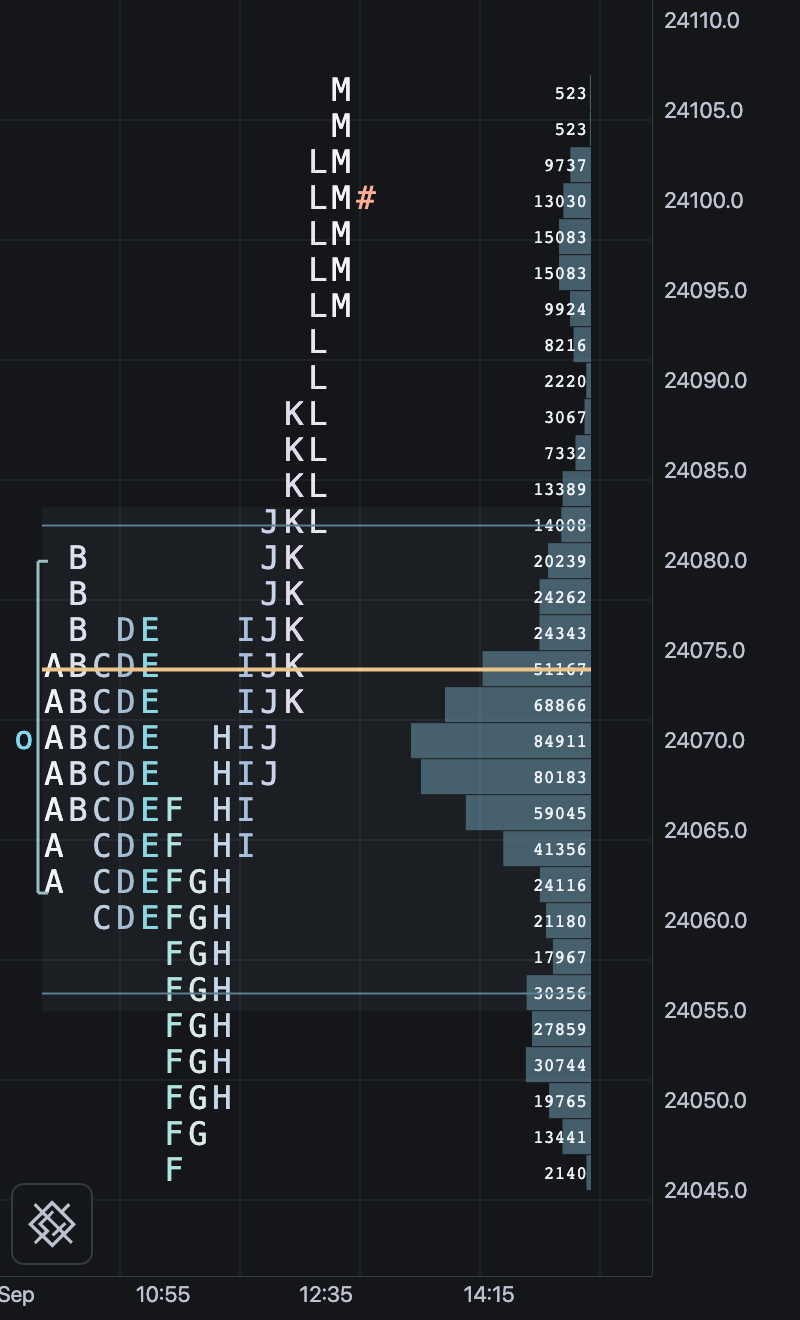
Charcoal, pale letters and muted cyan volume.
Try Graphite ↗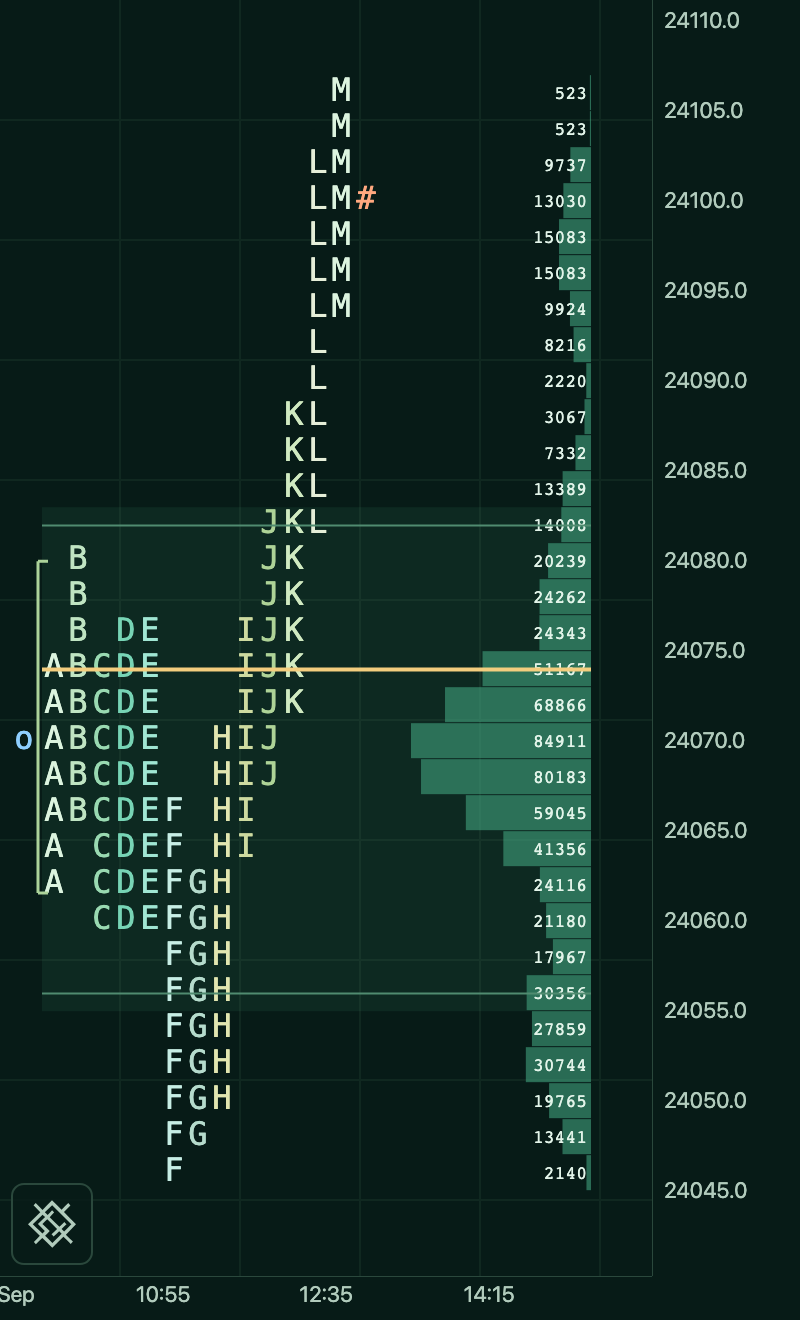
Deep green, mint letters and gold reference lines.
Try Emerald ↗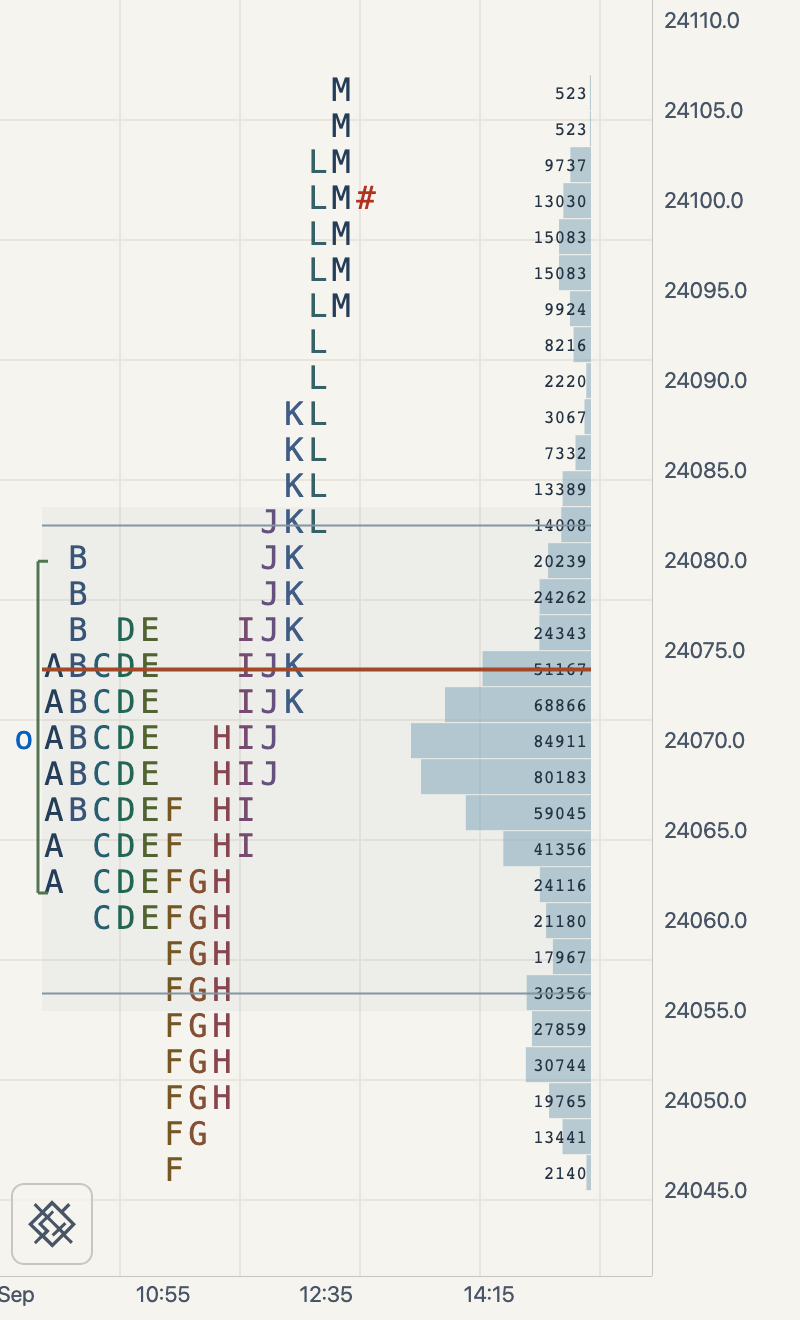
Warm light background, dark letters and blue-grey volume.
Try Ivory ↗Packed and split views
These close-ups show the same newest session in Graphite, at 18 CSS pixels per row with 16-pixel letters. Packed mode closes gaps between letters. Split mode assigns a fixed column to each period, so gaps reveal which periods did not trade a price row.
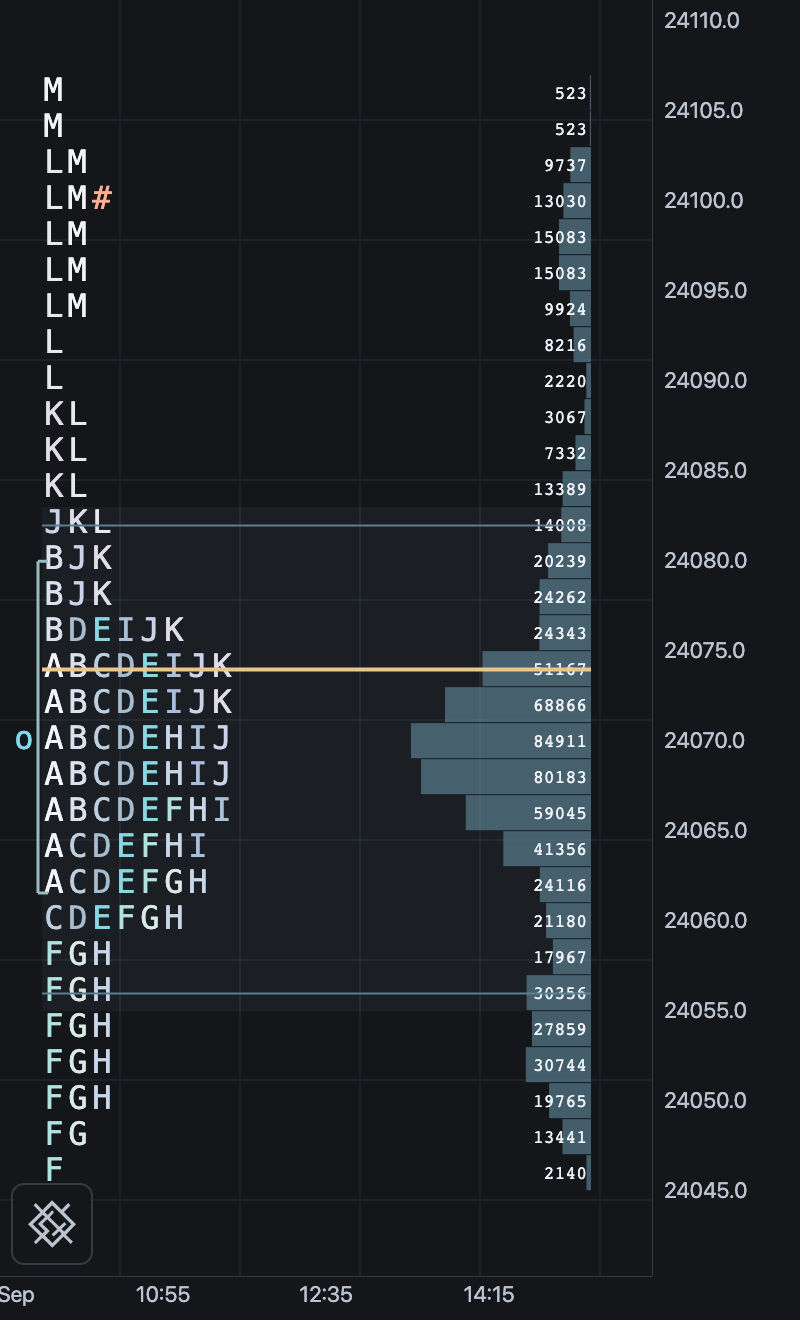
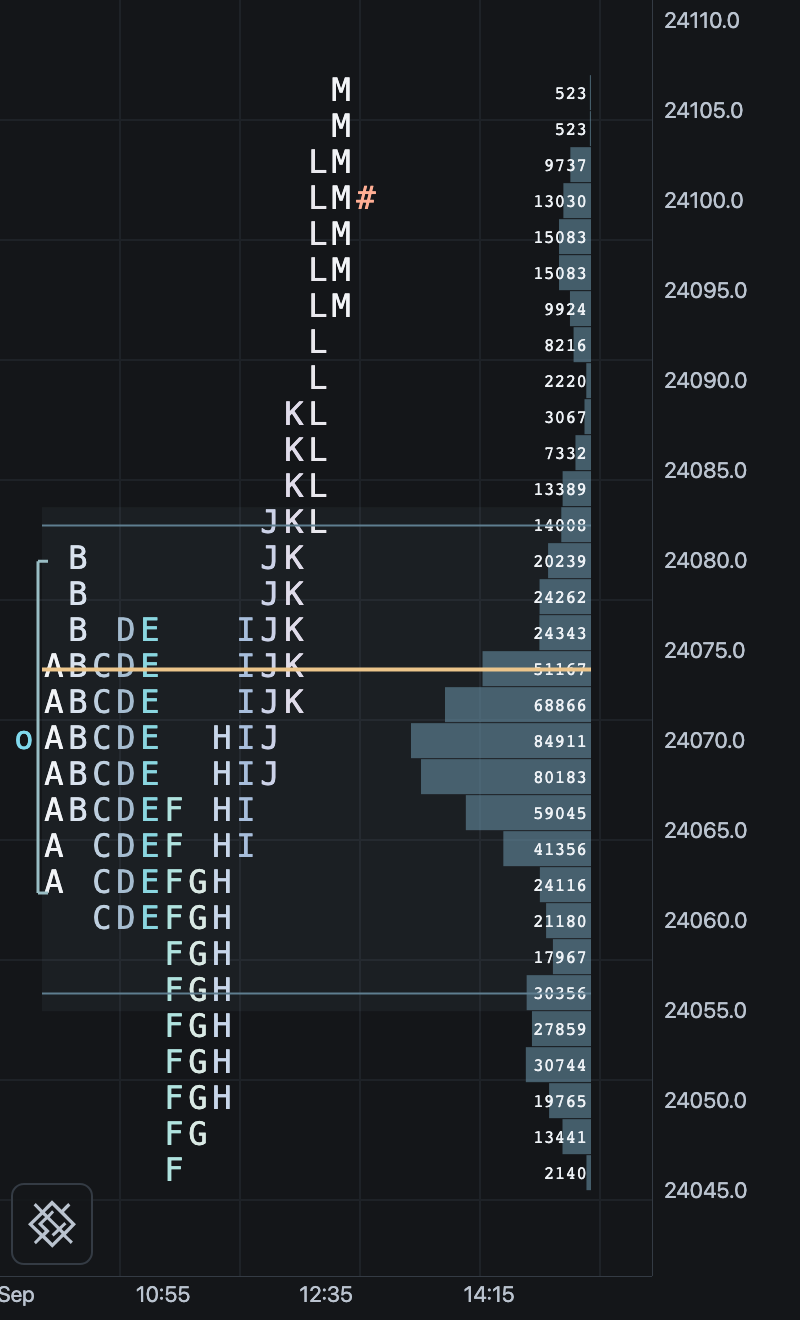
Both views retain the same POC, value area and price rows. o is the day’s open;
# marks the latest close on this newest supplied session. For historical data,
the newest supplied session is used rather than the computer’s calendar date.
Use it in your chart
const profile = new MarketProfile(result, {
  blockDisplay: 'compact',
  opacity: 1,
  showVolumeProfile: true,
  showVolumeValues: true,
  showSessionOpen: true,
  showLastPrice: true,
  showSinglePrints: false,
});
chart.addPrimitive(profile);

profile.setSessionSplit(2, true);  // Split the third supplied session.
profile.setSessionSplit(2, false); // Pack it again.
See Market Profile for computation, imports, options,
session identity, hover handling and live-data updates. These five palettes are
demo presets in examples/market-profile/themes.js; they are applied with the
public chart and profile APIs, and are not additional library exports.
The compact alphabet needs at least 5 physical pixels vertically and 3 horizontally. Below that, rows use small marks and exact letters remain in the tooltip. Canvas 2D draws these profiles; enabling WebGL2 is not required.