Live examples
Every chart on this page is the real library running in your browser - the code shown is the code that ran. Try it, copy it, ship it.
Jump to depth of market, drawing tools, market profiles, chart controls, or trading.
Branding and optional watermarks
The corner logo stays visible by default. The background symbol or custom text watermark is opt-in. Try the controls, both themes and phone width, then open Appearance in Chart settings. See Branding and Watermarks.
View example code
el.style.display = 'flex';
el.style.flexDirection = 'column';
const controls = document.createElement('div');
controls.style.cssText = 'display:flex;flex-wrap:wrap;gap:6px;padding:8px;flex-shrink:0';
const wrap = document.createElement('div');
wrap.style.cssText = 'display:flex;justify-content:center;flex:1;min-height:0;overflow:hidden';
const stage = document.createElement('div');
stage.style.cssText = 'width:100%;max-width:100%;height:100%;min-height:0';
wrap.appendChild(stage);
el.append(controls, wrap);

const bars = Array.from({ length: 150 }, (_, index) => {
  const close = 23800 + Math.sin(index / 9) * 28;
  return { time: 1700000000 + index * 300, open: close - 3,
    high: close + 7, low: close - 6, close, volume: 650 + index * 65 };
});
const widget = lib.createWidget(stage, {
  symbol: 'NIFTY SIM', exchange: 'NSE', interval: '5m',
  intervals: ['5m', '15m', '1h'], persist: false,
  feed: { getBars: async () => bars, subscribeBars: () => () => {} },
  navigation: { defaultVisibleBars: 80 },
  rail: { tools: ['trend-line', 'horizontal-line', 'rectangle'] },
});
const listeners = new AbortController();
function button(label, action) {
  const node = document.createElement('button');
  node.type = 'button';
  node.textContent = label;
  node.style.cssText = 'min-height:44px;padding:5px 9px;border:1px solid var(--oac-card-border);border-radius:5px;background:var(--oac-card);color:inherit;font:12px system-ui;cursor:pointer';
  node.addEventListener('click', action, { signal: listeners.signal });
  controls.appendChild(node);
  return node;
}
button('Toggle watermark', () => {
  widget.chart.setWatermarkOptions({ visible: !widget.chart.watermarkOptions().visible });
});
button('Automatic or custom text', () => {
  widget.chart.setWatermarkOptions({ text: widget.chart.watermarkOptions().text ? '' : 'Research' });
});
let brand = true;
const logo = button('Logo: on', () => {
  brand = !brand;
  widget.chart.setBranding(brand);
  logo.textContent = 'Logo: ' + (brand ? 'on' : 'off');
  logo.setAttribute('aria-pressed', String(brand));
});
logo.setAttribute('aria-pressed', 'true');
let narrow = false;
const width = button('Width: desktop', () => {
  narrow = !narrow;
  stage.style.width = narrow ? '360px' : '100%';
  width.textContent = narrow ? 'Width: phone' : 'Width: desktop';
  width.setAttribute('aria-pressed', String(narrow));
});
width.setAttribute('aria-pressed', 'false');
button('Switch theme', () => widget.setTheme(widget.theme() === 'dark' ? 'light' : 'dark'));
button('Chart settings', () => widget.openSettings());
return { destroy() { listeners.abort(); widget.destroy(); } };
Objects and compact dialogs
Find drawings, indicators and registered profiles in one panel. Hide, lock, edit or remove supported objects, or focus a drawing beyond the latest candle. Change the host width to try compact dialogs. See the Objects guide.
View example code
el.style.display = 'flex';
el.style.flexDirection = 'column';
const controls = document.createElement('div');
controls.style.cssText = 'display:flex;gap:6px;flex-wrap:wrap;padding:8px;flex-shrink:0';
const stage = document.createElement('div');
stage.style.cssText = 'flex:1;min-height:0;max-width:100%;width:100%';
el.append(controls, stage);
const bars = lib.generateBars(1700000000, 160, 60);
const widget = lib.createWidget(stage, {
  symbol: 'OBJECTS SIM', interval: '1m', intervals: ['1m'],
  rail: false, statusline: false, topbar: false,
  navigation: { defaultVisibleBars: 100 },
});
widget.series.setData(bars);
function addDrawing() {
  widget.draw.add({ tool: 'trend-line', paneIndex: 0,
    points: [{ time: bars[100].time, price: bars[100].low },
      { time: bars[140].time, price: bars[140].low }],
    style: { color: '#f0a020', lineWidth: 3 },
  });
}
addDrawing();
widget.draw.add({ tool: 'rectangle', paneIndex: 0,
  points: [{ time: bars[159].time + 20 * 60, price: bars[159].high + 2 },
    { time: bars[159].time + 35 * 60, price: bars[159].high + 5 }],
  style: { color: '#4da3ff', lineWidth: 2 },
});
widget.chart.addIndicator('rsi');
const profile = new lib.VolumeProfile(
  lib.computeVolumeProfileSessions(bars, { tickSize: 0.5, session: 'composite' }),
  { width: 60, showValueArea: false, showPocLabel: false },
);
widget.chart.addPrimitive(profile);
let exists = true;
let visible = true;
const unregister = widget.objects.register({
  id: 'session-profile',
  get: () => exists ? { kind: 'profile', name: 'Session profile', paneIndex: 0, visible } : null,
  setVisible(on) {
    if (visible === on) return;
    visible = on;
    if (on) widget.chart.addPrimitive(profile); else widget.chart.removePrimitive(profile);
  },
  remove() { widget.chart.removePrimitive(profile); exists = false; },
});
function button(label, action) {
  const node = document.createElement('button');
  node.textContent = label;
  node.type = 'button';
  node.style.cssText = 'padding:5px 9px;border:1px solid var(--oac-card-border);border-radius:4px;background:var(--oac-card);color:inherit;font:12px system-ui';
  node.addEventListener('click', action);
  controls.appendChild(node);
  return node;
}
button('Open Objects', () => widget.openObjects());
button('Add drawing', addDrawing);
button('Add RSI', () => widget.chart.addIndicator('rsi'));
button('Undo drawing action', () => widget.draw.undo());
let compact = false;
const widthButton = button('Width: fit', () => {
  compact = !compact;
  stage.style.width = compact ? '350px' : '100%';
  widthButton.textContent = compact ? 'Width: 350 px' : 'Width: fit';
  widthButton.setAttribute('aria-pressed', String(compact));
});
widthButton.setAttribute('aria-pressed', 'false');
let saved;
const restoreButton = button('Restore layout', () => {
  if (saved) widget.restoreState(saved);
});
restoreButton.disabled = true;
button('Save layout', () => {
  saved = JSON.parse(JSON.stringify(widget.getState()));
  restoreButton.disabled = false;
});
return { destroy() { unregister(); widget.destroy(); } };
Managed data loading
Load older history, simulate a failed refresh and retry, or hold the display while live updates continue. The data-loading guide explains the shared controller for widgets and custom terminals.
View example code
el.style.display = 'flex';
el.style.flexDirection = 'column';
const controls = document.createElement('div');
controls.style.cssText = 'display:flex;gap:6px;flex-wrap:wrap;padding:8px;min-height:48px;flex-shrink:0';
const stage = document.createElement('div');
stage.style.cssText = 'flex:1;min-height:0';
el.append(controls, stage);
const now = 1789093800;
const price = value => Math.round((23800 + (value - 100) * 4) * 20) / 20;
const bars = lib.generateBars(now - 359 * 60, 360, 60).map(bar => ({
  ...bar, open: price(bar.open), high: price(bar.high),
  low: price(bar.low), close: price(bar.close),
  volume: Math.round(bar.volume / 65) * 65,
}));
let failNext = false;
let empty = false;
let requests = 0;
let reconnect;
const counter = document.createElement('span');
counter.style.cssText = 'font:12px system-ui;padding:7px';
const source = {
  async getBars(request) {
    counter.textContent = 'History requests: ' + ++requests;
    await new Promise((resolve, reject) => {
      const stop = () => { clearTimeout(timer); reject(new Error('Cancelled')); };
      const timer = setTimeout(() => {
        request.signal?.removeEventListener('abort', stop);
        resolve();
      }, 700);
      request.signal?.addEventListener('abort', stop, { once: true });
      if (request.signal?.aborted) stop();
    });
    if (failNext) { failNext = false; throw new Error('Simulated connection failure'); }
    if (empty) return [];
    return bars.filter(bar => bar.time >= request.from && bar.time <= request.to);
  },
  async getBarsPage(request) {
    const older = await this.getBars({ ...request, from: bars[0].time });
    return { bars: older.slice(-60), hasMore: older.length > 60 };
  },
  subscribeBars(request, onBar, options) {
    reconnect = options.onResync;
    let seed = 0x31f2c7;
    const random = () => {
      seed = (Math.imul(seed, 1664525) + 1013904223) >>> 0;
      return seed / 4294967296;
    };
    const timer = setInterval(() => {
      if (empty) return;
      const last = bars[bars.length - 1];
      const close = Math.round((last.close + (random() - 0.5) * 2) * 20) / 20;
      const live = { ...last, close, high: Math.max(last.high, close),
        low: Math.min(last.low, close), volume: last.volume + (1 + Math.floor(random() * 6)) * 65 };
      bars[bars.length - 1] = live;
      onBar({ ...live });
    }, 800);
    return () => clearInterval(timer);
  },
};
const feed = lib.withBarCache(source, { now: () => now * 1000 });
const widget = lib.createWidget(stage, {
  feed, symbol: 'NIFTY SIM', exchange: 'NFO', interval: '1m', intervals: ['1m'],
  rail: false, indicators: false, lookbackBars: 120, loading: { now: () => now, pageSize: 60 },
  navigation: { defaultVisibleBars: 100 },
});
function button(label, action) {
  const button = document.createElement('button');
  button.textContent = label;
  button.type = 'button';
  button.style.cssText = 'padding:5px 9px;border:1px solid #64748b;border-radius:4px;font:12px system-ui';
  button.addEventListener('click', action);
  controls.appendChild(button);
}
button('Load older', () => void widget.dataController.loadMore());
button('Fail refresh', () => { failNext = true; void widget.reload(); });
button('Reconnect', () => reconnect?.());
button('Pause / resume display', () => {
  widget.dataController.setPaused(!widget.dataController.getState().paused);
});
button('Empty / restore', () => {
  empty = !empty;
  widget.setSymbol(empty ? 'EMPTY SIM' : 'NIFTY SIM', 'NFO');
});
controls.appendChild(counter);
return widget;
Depth of market
Watch a simulated live order book, pause updates, and group multiple ticks into one price row. The depth-of-market guide explains feed integration and price aggregation. All data and interactions here are simulated.
Loading depth chart…
| Bid qty | Price | Ask qty |
|---|
Drawing tools
Choose a tool, draw on the chart, then select it to move or delete it. Try undo and redo with the visible controls. See the drawing tools guide for the full tool catalogue and integration API. Open the full-size drawing gallery to inspect editable samples of all 85 tools, including pitchforks, harmonic patterns and advanced geometry.
View the running example source
// In your app: import { createChart, generateBars } from 'openalgo-charts';
// import { DrawingController, getDrawingTool } from 'openalgo-charts/draw';
// The website supplies these exports as lib and a sized container as el.
const root = document.createElement('div');
root.className = 'oac-draw-playground';
root.innerHTML = `
  <div class="oac-draw-playground__rail" role="group" aria-label="Drawing tools"></div>
  <div class="oac-draw-playground__main">
    <div class="oac-draw-playground__actions" role="group" aria-label="Drawing actions">
      <select aria-label="Select a drawing"></select>
    </div>
    <div class="oac-draw-playground__plot" tabindex="0" aria-label="Interactive drawing chart"></div>
    <div class="oac-draw-playground__status" role="status" aria-live="polite"></div>
  </div>`;
el.appendChild(root);
const rail = root.querySelector('.oac-draw-playground__rail');
const actions = root.querySelector('.oac-draw-playground__actions');
const plot = root.querySelector('.oac-draw-playground__plot');
const status = root.querySelector('[role="status"]');
const selection = root.querySelector('select');
const listeners = new AbortController();
const listen = (node, event, handler) => node.addEventListener(event, handler, { signal: listeners.signal });

const chart = lib.createChart(plot);
const bars = lib.generateBars(1700000000, 160, 3600);
chart.addSeries('candlestick').setData(bars);
chart.timeScale.fitContent(bars.length);
const draw = new lib.DrawingController(chart, { magnet: 'weak', stayInDrawingMode: false });
const point = (index, price) => ({ time: bars[index].time, price });

// Seed three editable drawings, then start with an empty undo history.
draw.add({ id: 'demo-trend', tool: 'trend-line', paneIndex: 0,
  points: [point(15, bars[15].low), point(75, bars[75].low)],
  style: { color: '#4f8cff', lineWidth: 2 } });
draw.add({ id: 'demo-zone', tool: 'rectangle', paneIndex: 0,
  points: [point(93, bars[93].high), point(137, bars[137].low)],
  style: { color: '#14b8a6', fill: true, fillOpacity: 0.14, lineWidth: 2 },
  text: { value: 'Supply zone', color: '#14b8a6', position: 'inside', valign: 'top' } });
draw.add({ id: 'demo-level', tool: 'horizontal-line', paneIndex: 0,
  points: [point(0, bars[45].low)],
  style: { color: '#f5a623', lineStyle: 'dashed', lineWidth: 2 } });
const initial = draw.toJSON();
draw.fromJSON(initial);

const quickTools = [
  [null, 'Cursor', 'Click a drawing to select it; drag its body or handles.'],
  ['trend-line', 'Trend line', 'Click a start and end point, or drag across the chart.'],
  ['horizontal-line', 'Horizontal line', 'Click once to mark a price level.'],
  ['ray', 'Ray', 'Click two points to project a line to the right.'],
  ['rectangle', 'Rectangle', 'Click two opposite corners, or drag to mark a zone.'],
  ['fib-retracement', 'Fibonacci', 'Click the swing low and high to place a retracement.'],
  ['long-position', 'Long position', 'Click entry, then target; drag the stop or target to adjust.'],
  ['measure', 'Measure', 'Click two points to measure price, time and volume.'],
  ['brush', 'Brush', 'Press, draw a stroke, and release.'],
];
const tools = [quickTools[0], ...lib.registeredDrawingTools().map(tool => [
  tool.id, tool.name, tool.freehand ? 'Press, draw, and release.' :
    tool.points === 0 ? 'Click each point, then double-click to finish.' :
    'Click ' + tool.points + ' point(s) to place the drawing.',
])];
const catalog = document.createElement('select');
catalog.setAttribute('aria-label', 'All drawing tools');
catalog.add(new Option('All drawing tools...', ''));
for (const [id, name] of tools.slice(1)) catalog.add(new Option(name, id));
actions.prepend(catalog);
listen(catalog, 'change', () => {
  draw.setTool(catalog.value || null);
  plot.focus({ preventScroll: true });
  refresh();
});
const toolButtons = new Map();
function button(parent, label, action) {
  const node = document.createElement('button');
  node.type = 'button';
  node.textContent = label;
  listen(node, 'click', () => { action(); refresh(); });
  parent.appendChild(node);
  return node;
}
for (const [id, label, instruction] of quickTools) {
  const node = button(rail, label, () => { draw.setTool(id); plot.focus({ preventScroll: true }); });
  node.title = instruction;
  toolButtons.set(id, node);
}
const undo = button(actions, 'Undo', () => draw.undo());
const redo = button(actions, 'Redo', () => draw.redo());
const remove = button(actions, 'Delete', () => draw.removeMany(draw.selection()));
button(actions, 'Reset demo', () => {
  draw.setTool(null);
  draw.fromJSON(initial);
  chart.timeScale.fitContent(bars.length);
});

function refresh() {
  const active = draw.activeTool();
  catalog.value = active || '';
  const picked = draw.get(draw.selected());
  const label = drawing => drawing.text?.value || lib.getDrawingTool(drawing.tool).name;
  const rows = draw.drawings();
  selection.replaceChildren(new Option('Select a drawing...', ''));
  rows.forEach(drawing => selection.add(new Option(label(drawing), drawing.id)));
  selection.value = picked?.id || '';
  toolButtons.forEach((node, id) => node.setAttribute('aria-pressed', String(id === active)));
  undo.disabled = !draw.canUndo();
  redo.disabled = !draw.canRedo();
  remove.disabled = draw.selection().length === 0;
  const tool = tools.find(([id]) => id === active);
  status.textContent = rows.length + ' drawings · ' +
    (active ? tool[1] + ': ' + tool[2] : picked ? 'Selected: ' + label(picked) + '. Drag its body or handles.' : tool[2]);
}
listen(selection, 'change', () => {
  const id = selection.value || null;
  draw.setTool(null);
  draw.select(id);
  refresh();
});

// Shortcuts belong to this playground, so another chart or a text field keeps its keys.
listen(root, 'keydown', event => {
  if (event.target.closest('input, textarea, select, [contenteditable="true"]')) return;
  if (event.key === 'Escape') draw.setTool(null);
  else if (event.key === 'Delete' || event.key === 'Backspace') draw.removeMany(draw.selection());
  else if ((event.ctrlKey || event.metaKey) && event.key.toLowerCase() === 'z') {
    event.shiftKey ? draw.redo() : draw.undo();
  } else return;
  event.preventDefault();
  event.stopPropagation();
  refresh();
});
const off = ['draw:tool', 'drawing:select', 'drawing:change'].map(event => chart.on(event, refresh));
refresh();

// Unmounts and site-theme changes release the controller and every host listener.
const destroy = chart.destroy.bind(chart);
chart.destroy = () => {
  listeners.abort();
  off.forEach(unsubscribe => unsubscribe());
  draw.destroy();
  destroy();
  root.remove();
};
return chart;
Compact market profiles
2.1.0: inspect small TPO letters and volume values, right-click to split
or unsplit one day, and compare Dark, Blue, Graphite, Emerald and Ivory themes.
Lowercase o marks each day’s open; # appears only on the newest session.
The six sessions are synthetic data. The full guide is Profile Demo & Themes.
Use the full-size profiles selector to switch between
Volume Profile, TPO letters and the current order-flow demo with its themes,
text colors, lot display and optional statistics table.
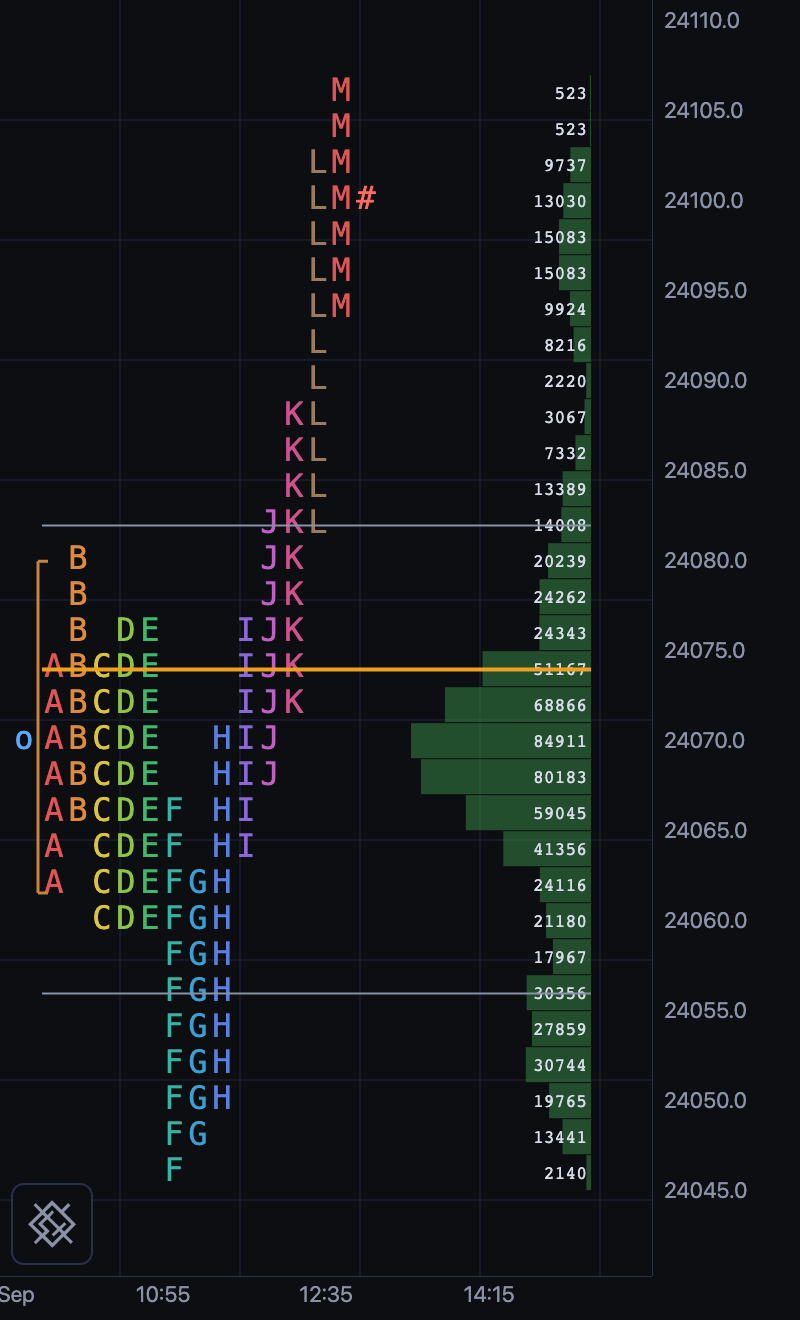
Multicolour periods on a dark background.
Try Dark ↗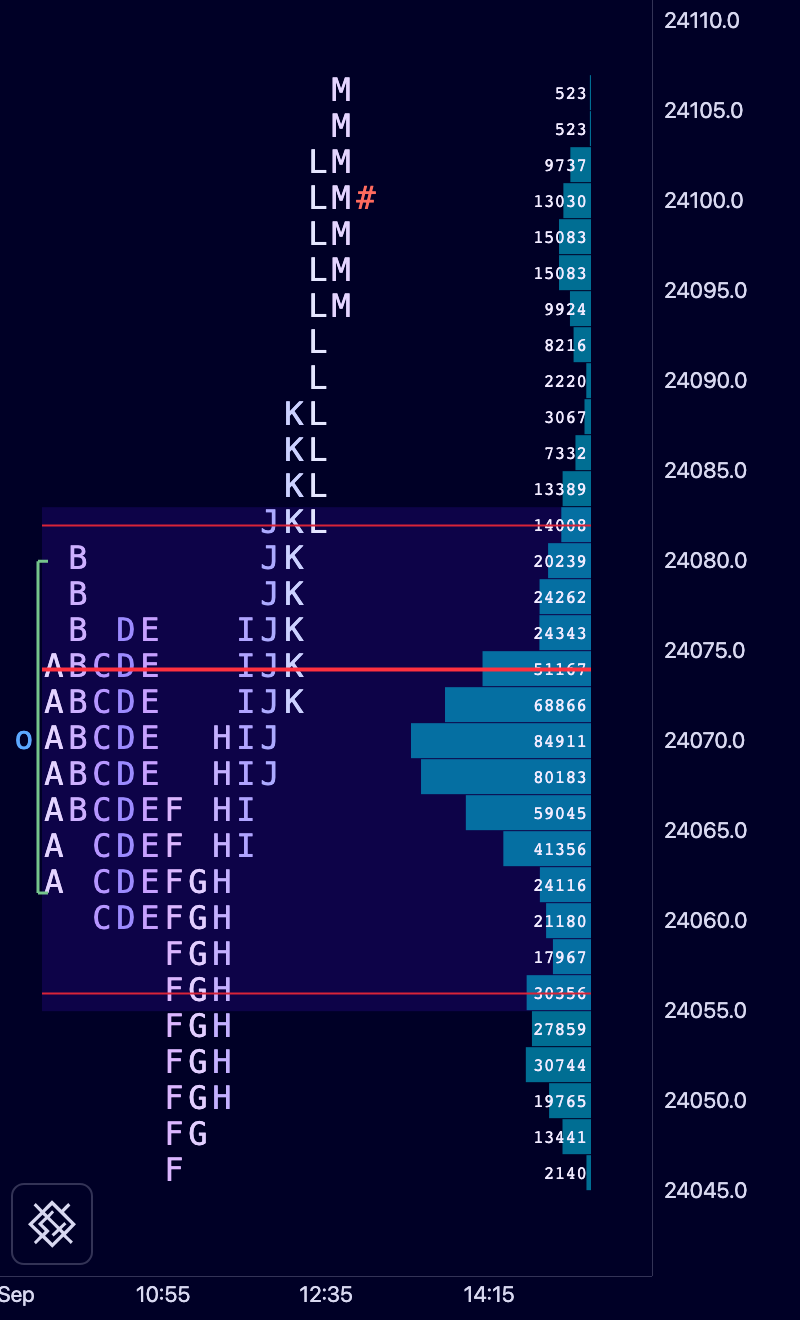
Navy background, purple letters and cyan volume.
Try Blue ↗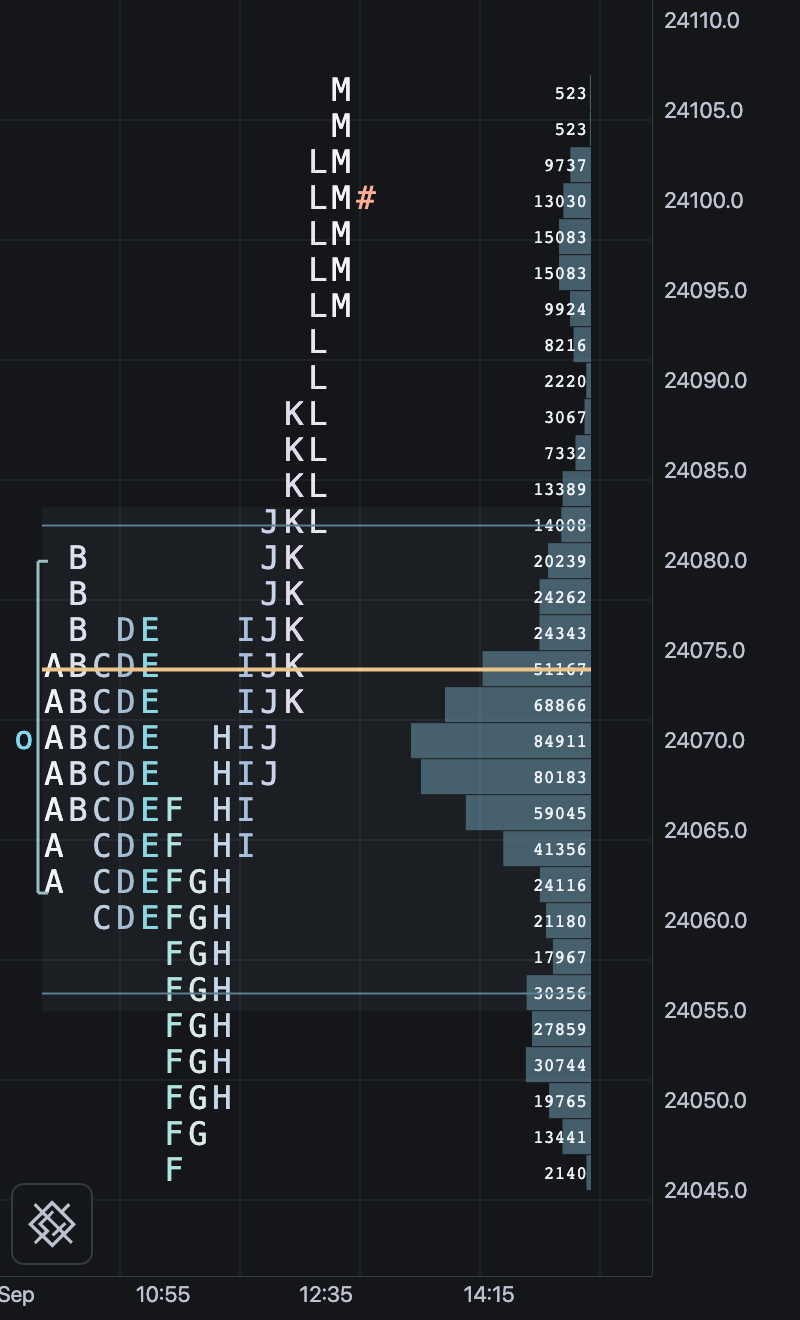
Charcoal, pale letters and muted cyan volume.
Try Graphite ↗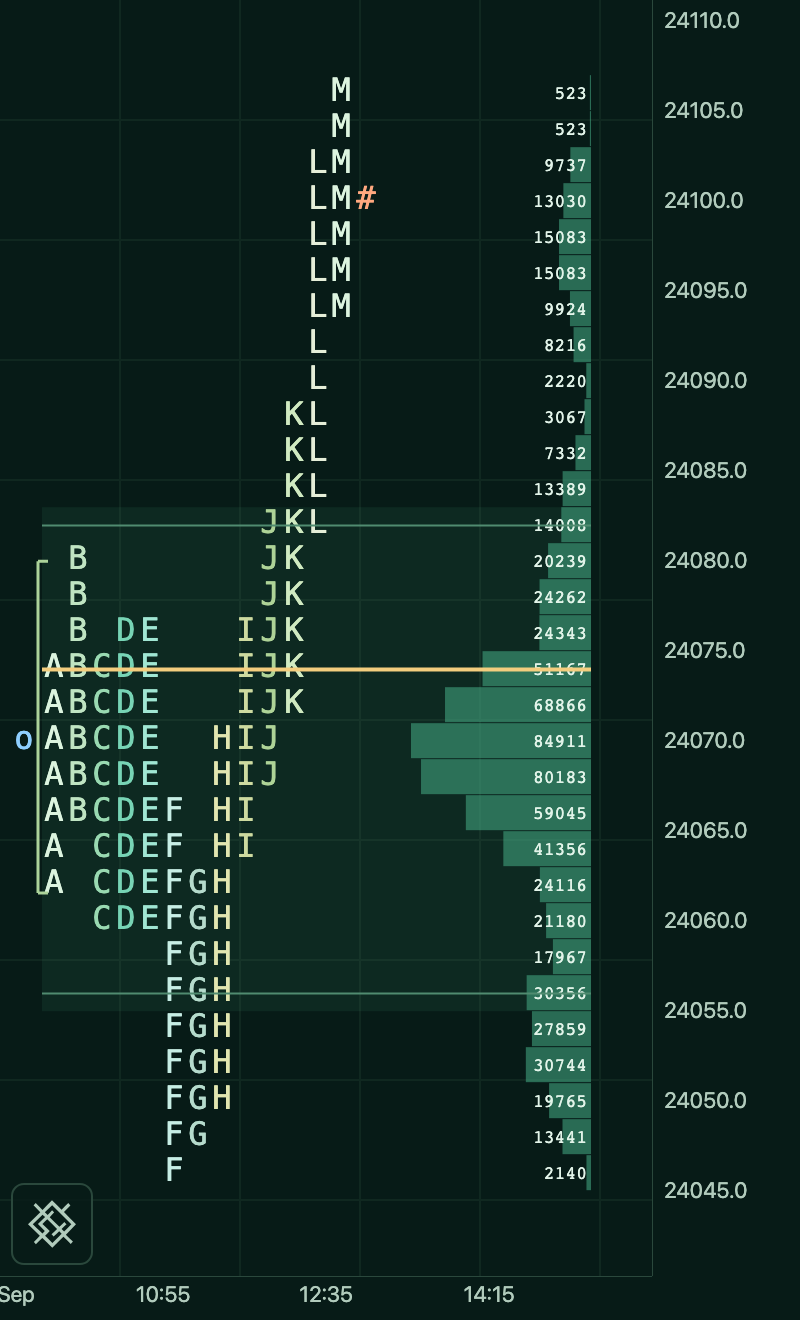
Deep green, mint letters and gold reference lines.
Try Emerald ↗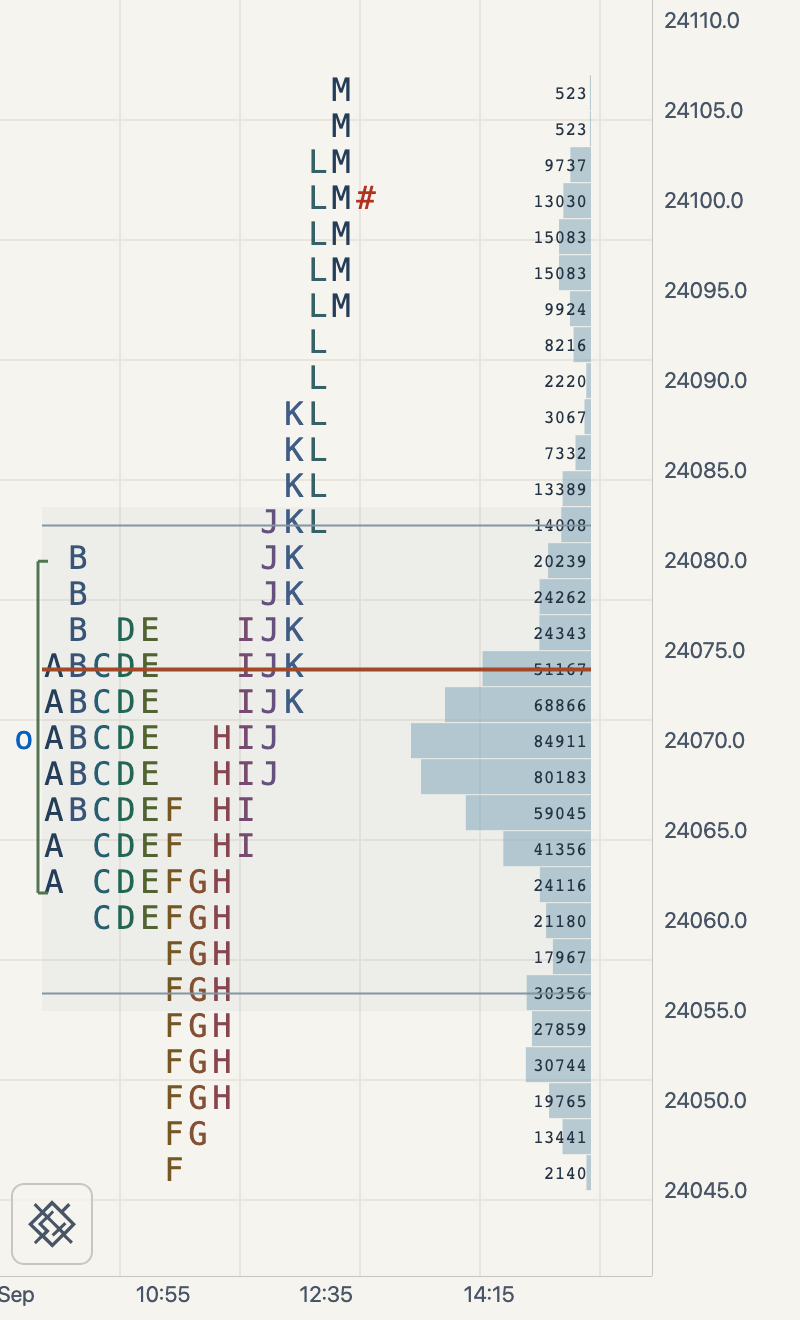
Warm light background, dark letters and blue-grey volume.
Try Ivory ↗Interactive
Switch tabs to reconfigure each chart live.
Chart type
Custom theme
Data tooltip
Event markers
Range switcher
Legend
Series compare
Indicators & markers
Price scale
Custom chart types
Scales formatting
Scales config
Data
Custom plugins
Trading
Data-driven positions, orders, TP/SL brackets, and fill markers via
chart.trading. Drag the order lines; the pill ✕ fires cancel/close.
Positions & orders
Trade markers
The terminal in one call
createWidget from openalgo-charts/widget builds the chart with its chrome: a top bar
(symbol, interval, chart type, indicators, capture, settings, theme), the drawing rail, a
status line, dialogs generated from the settings schemas the engine already ships, a
right-click menu and a keymap with a ? panel. The engine underneath still ships no DOM;
the widget is a packaged host driving the same public API your own would. Pick a tool
from the rail, open Indicators, change the chart type, press ?.
View example code
const widget = lib.createWidget(el, {
symbol: 'DEMO',
exchange: 'NSE',
interval: '1h',
intervals: ['5m', '15m', '1h', '1d'],
});

// Without a feed the host puts bars on the primary series itself. A feed
// would make setSymbol, setInterval and reload() fetch through it.
const bars = lib.generateBars(1700000000, 240, 3600);
widget.series.setData(bars);
widget.chart.timeScale.fitContent(160);

// The chrome's own facts arrive as events; the chart's bus is still there on widget.chart.
widget.on('interval', function (e) {
widget.context.status('Interval ' + e.interval + ' (no feed wired, so the bars stay)');
});
return widget;
Every option, event and theming token is on The Widget Tier.
Custom indicators
The 102 built-ins are not special-cased. Each is a descriptor - inputs, plots and a
calc - and anything you register with registerIndicator uses the same contract,
so it gets generated settings, a legend entry and state persistence for free.
This one computes a trend regime, then uses four descriptor hooks on the result:
colorBy for the line, barColors to repaint the candles, background to shade the
pane, and markers to flag each flip. No fork, no build step.
View example code
lib.registerIndicator({
id: 'demo-regime',
name: 'Trend Regime',
category: 'Custom',
placement: 'onchart',
inputs: [
  { key: 'length', type: 'number', label: 'Length', default: 20, min: 2, max: 200, step: 1 },
  { key: 'up', type: 'color', label: 'Bull', default: '#26a69a' },
  { key: 'down', type: 'color', label: 'Bear', default: '#ef5350' },
],
plots: [{
  key: 'basis', type: 'line', title: 'Basis', style: { lineWidth: 2 },
  // colorBy is a function, not the name of a column. It runs per bar and
  // returns a colour, or undefined to fall back to the plot's own.
  colorBy: ({ index, values, settings }) => {
    const t = values.trend[index];
    return t == null ? undefined : t > 0 ? settings.up : settings.down;
  },
}],
calc(bars, s) {
  const close = lib.sourceValues(bars, 'close');
  const basis = lib.nulls(lib.sma(close, Math.max(2, s.length | 0)));
  const trend = basis.map((b, i) => (b == null ? null : close[i] >= b ? 1 : -1));
  return { basis, trend };
},
// Repaint the price candles by regime.
barColors({ values, settings }) {
  return values.trend.map((t) => (t == null ? null : t > 0 ? settings.up : settings.down));
},
// Shade the whole pane behind them.
background({ values, settings }) {
  return values.trend.map((t) =>
    t == null ? null : lib.withAlpha(t > 0 ? settings.up : settings.down, 0.07));
},
// Flag every flip, anchored to the candle rather than to the indicator line.
markers({ bars, values, settings }) {
  const out = [];
  for (let i = 1; i < bars.length; i++) {
    const a = values.trend[i - 1], b = values.trend[i];
    if (a == null || b == null || a === b) continue;
    out.push({
      time: bars[i].time,
      position: 'atPrice',
      price: b > 0 ? bars[i].low : bars[i].high,
      shape: b > 0 ? 'arrowUp' : 'arrowDown',
      color: b > 0 ? settings.up : settings.down,
      text: b > 0 ? 'BULL' : 'BEAR',
    });
  }
  return out;
},
});

const chart = lib.createChart(el);
const bars = lib.generateBars(1700000000, 200, 3600);
chart.addSeries('candlestick').setData(bars);
chart.addIndicator('demo-regime');
chart.timeScale.fitContent(bars.length);
return chart;
A descriptor can also supply draws for free-standing lines, boxes and labels,
levels for data-derived horizontals, fills between plots, table for an on-chart
grid, and alerts the chart evaluates for you. See
Indicators for the full contract.
Render backends and vector export
The series pass goes through a render backend port. renderer: 'auto' takes the WebGL2
backend from openalgo-charts/webgl where the device has WebGL2 and the 2D path
otherwise, decided once at construction; chart.rendererKind reports which one is
painting. Pan and zoom: the candles are batched into one GPU draw call per frame and
composited into the pane’s own canvas, so screenshots, drawings, axes and text are
unchanged.
View example code
const chart = lib.createChart(el, { renderer: 'auto' });
const bars = lib.generateBars(1700000000, 600, 3600);
chart.addSeries('candlestick').setData(bars);
chart.timeScale.fitContent(240);

// Decided once, at construction: 'webgl2' where WebGL2 works, else 'canvas2d'.
el.style.position = 'relative';
const tag = document.createElement('div');
tag.style.cssText = 'position:absolute;right:64px;bottom:30px;z-index:5;font:12px ui-monospace,monospace;background:rgba(0,0,0,.55);color:#e6edf3;padding:4px 8px;border-radius:6px;pointer-events:none';
function show(note) { tag.textContent = 'rendererKind: ' + chart.rendererKind + (note ? '  ' + note : ''); }
show(lib.isWebGL2Supported() ? '' : '(no WebGL2 on this device)');
// A lost context moves the chart to the 2D path for the session and says so once.
chart.on('renderer:fallback', function (e) { show('(fell back: ' + e.reason + ')'); });
el.appendChild(tag);
return chart;
chart.exportSVG() writes the same frame as a standalone vector document: axis labels
and tags stay text, lines stay lines, and nothing transient (crosshair, hover, drag) is in
it. The right half below is the string the left half returned, inlined as markup and
re-exported as you pan or zoom the live chart.
View example code
el.style.display = 'flex';
el.style.gap = '10px';
const live = document.createElement('div');
live.style.cssText = 'flex:1 1 0;min-width:0;height:100%;position:relative';
const out = document.createElement('div');
out.style.cssText = 'flex:1 1 0;min-width:0;height:100%;overflow:hidden;border:1px dashed #5b6478;border-radius:6px;line-height:0';
el.appendChild(live);
el.appendChild(out);

const chart = lib.createChart(live);
const bars = lib.generateBars(1700000000, 120, 3600);
chart.addSeries('candlestick').setData(bars);
chart.addPriceLine({ price: bars[bars.length - 1].close, color: '#f5a623', lineWidth: 1, dashed: true, id: 'last' });
chart.timeScale.fitContent(120);

// One export per frame at most: the string is the whole paint, so exporting
// on every zoom event during a wheel glide would repeat the work.
let queued = false;
function exportNow() {
// Sized to the target panel rather than the live chart: the chart lays
// itself out for the export and puts the live layout back before returning.
// queued stays set until the export is done, so nothing the export itself
// does can schedule the next one: an export that re-queued on its own
// relayout would run once per frame for as long as the page is open.
try { out.innerHTML = chart.exportSVG({ width: out.clientWidth, height: out.clientHeight }); }
finally { queued = false; }
}
function queueExport() { if (!queued) { queued = true; requestAnimationFrame(exportNow); } }
chart.on('resize', queueExport);   // the first measured layout, and any later one
chart.on('zoom', queueExport);
chart.on('pan', queueExport);
requestAnimationFrame(function () { requestAnimationFrame(queueExport); });
return chart;
The options, the fallback rules and the serialising context behind the export are on Render Backends & SVG Export.
Copy-paste snippets
Want the full walkthrough? Head to the documentation.