Every move.A clearer view.
Go from watching the market to exploring it.
Beautiful charts. Powerful tools. A perspective that’s yours.
There’s more to
every market move.
Follow the trend. Connect the dots. See what you couldn’t see before.
Look beneath the surface.
Bring price, momentum, and volatility into focus with 112 indicators. Layer your favorites and explore the bigger picture.
Explore indicatorsGive your ideas a shape.
Mark a level. Map a scenario. Tell the story you see with 87 drawing tools that put your thinking right on the chart.
Try the drawing toolsA fresh perspective, instantly.
From the detail of candlesticks to the simplicity of a line. Find your rhythm with 13 chart types and a look that feels like you.
Find your viewBuilt in.
Drawn on real prices.
Supertrend, HalfTrend and AlphaTrend are part of the 112 indicators, not plugins, and each study draws its own signals.
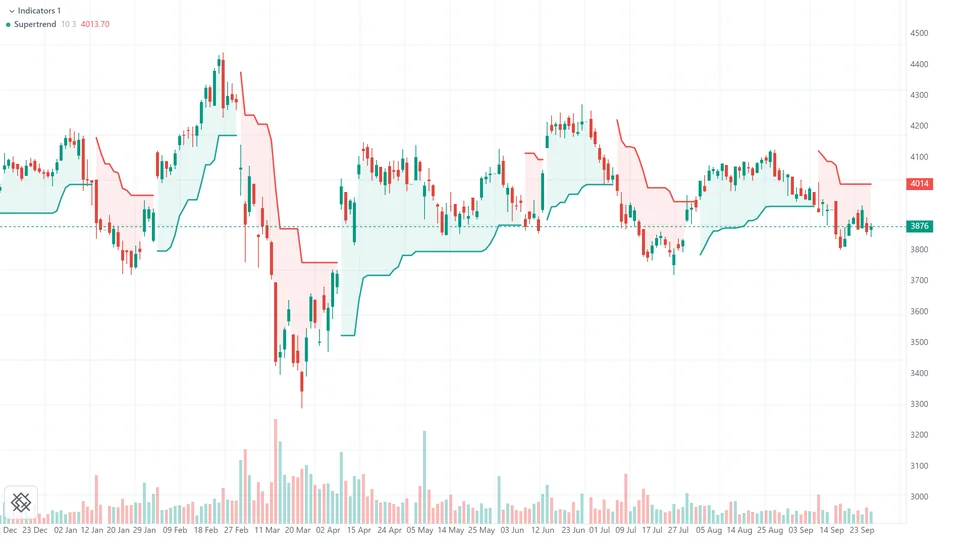
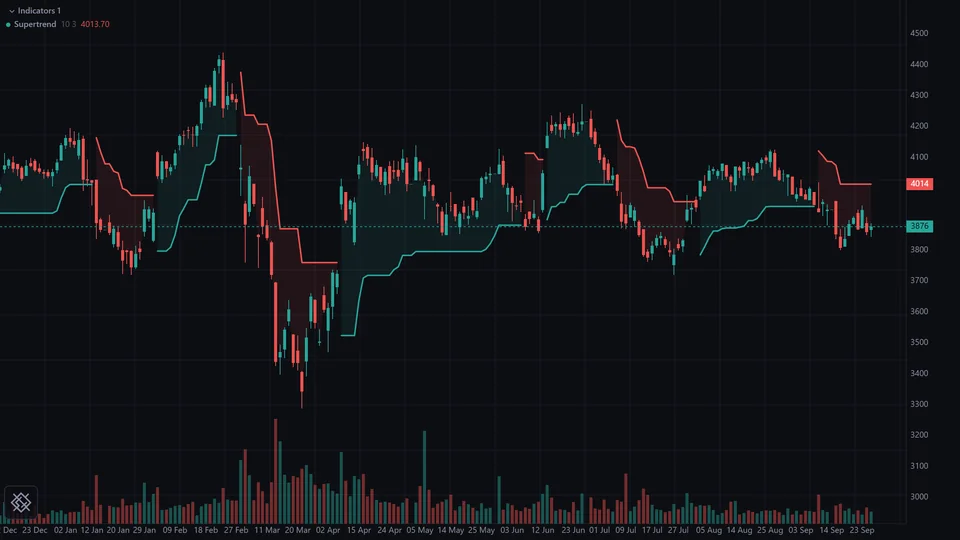
Supertrend
An ATR band that flips colour where the trend turns.
LT daily, period 10, multiplier 3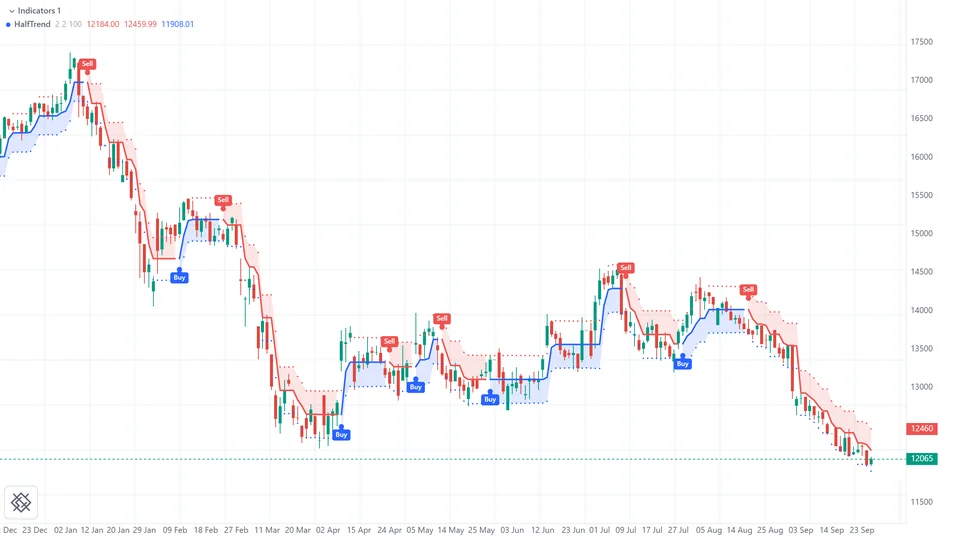
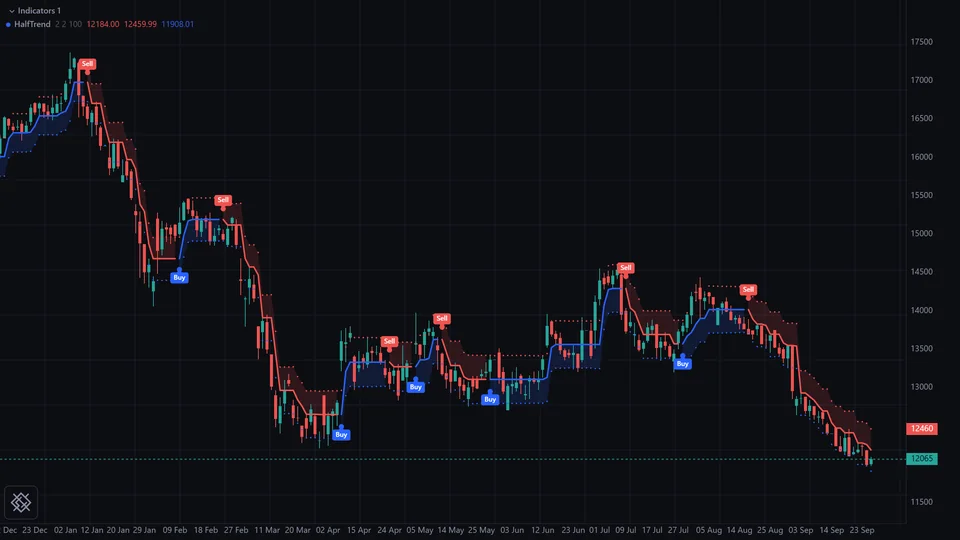
HalfTrend
A trend line inside its ATR channel, with buy and sell signals.
MARUTI daily, amplitude 2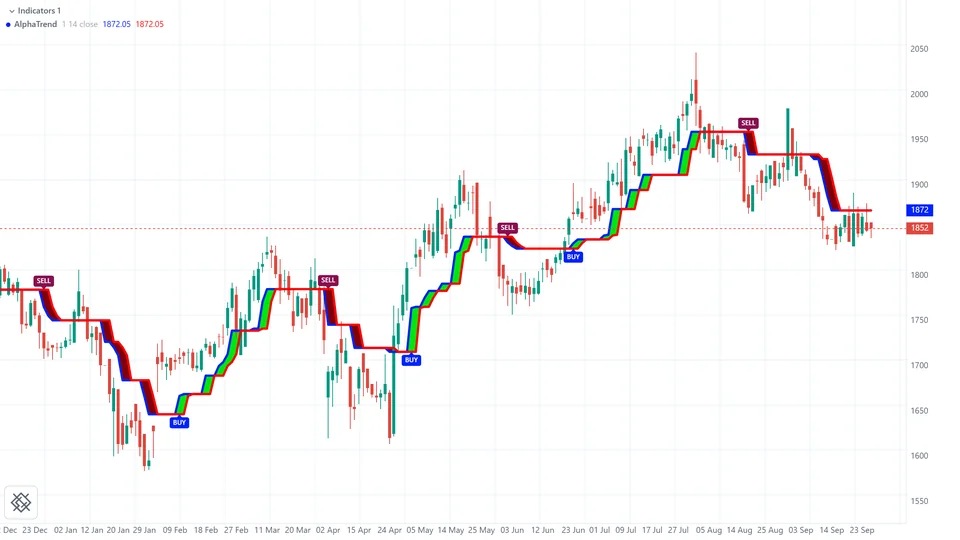
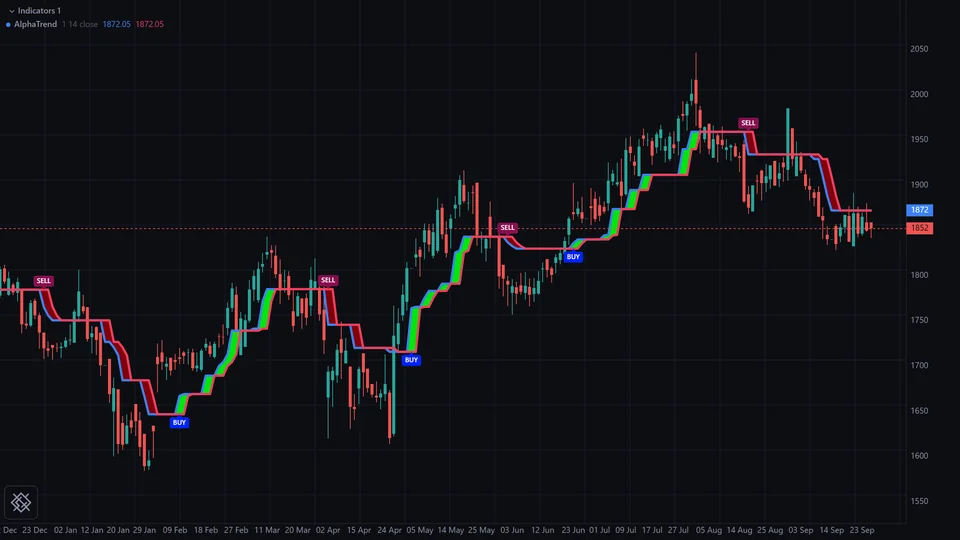
AlphaTrend
The trend line and its lag, shaded between, with crossover signals.
SUNPHARMA dailyTrade it. Replay it.
Script it.
Every picture below is the library itself, drawing real NSE prices.
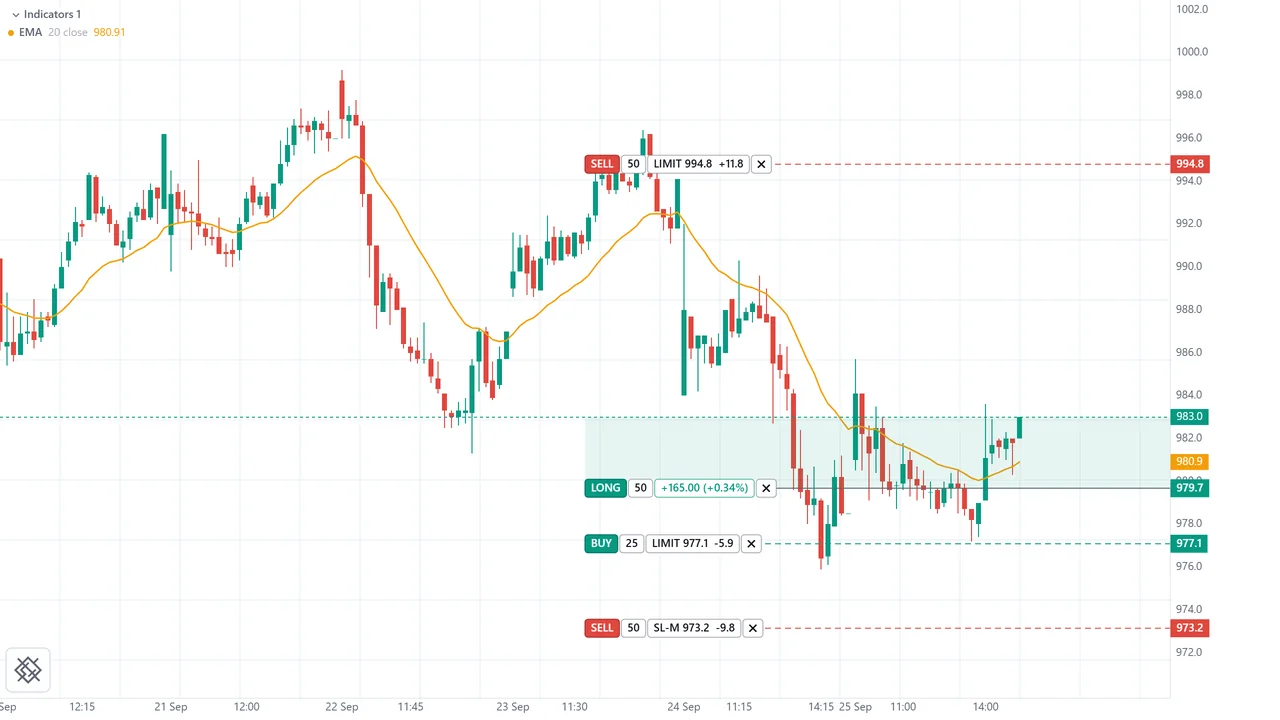
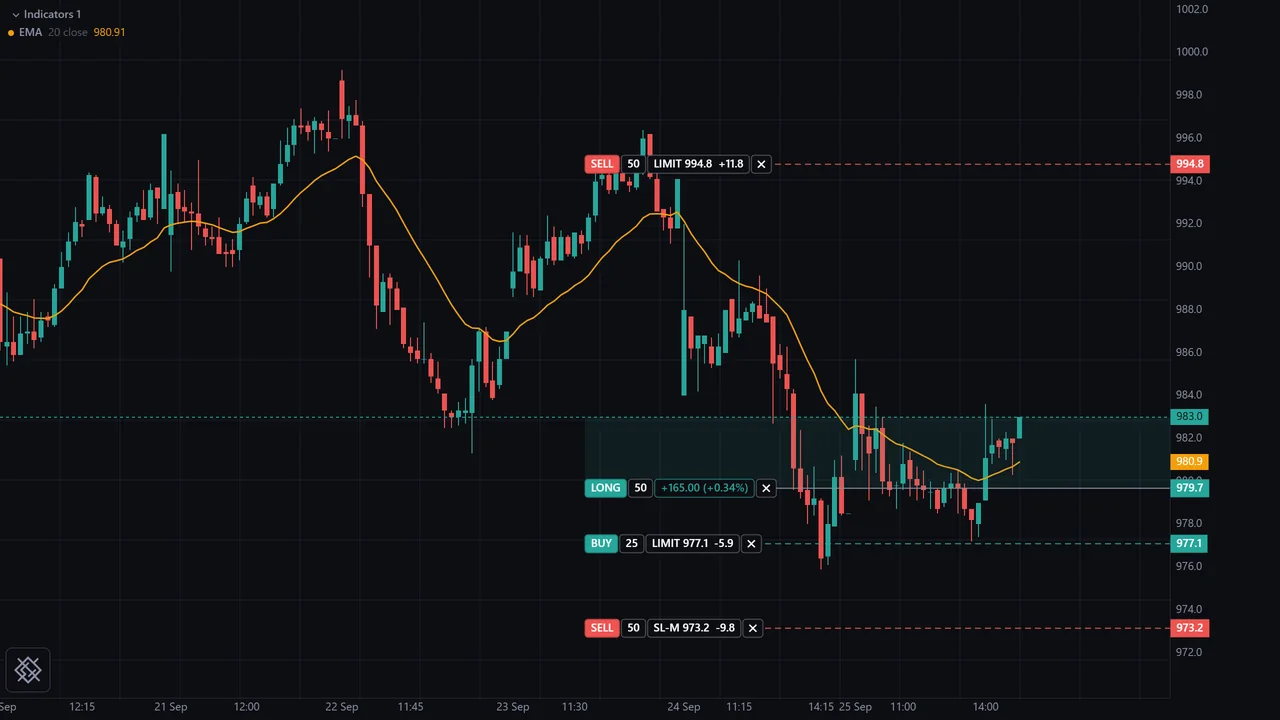
Orders you can see and drag.
Order, stop and target lines sit on the price they belong to. Drag one to modify it, and watch the position line carry its live P&L.
- Tick size, price band and freeze quantity are checked before an order leaves the chart.
- Everything starts in analyzer mode, the sandbox, until you choose live.
- The chart only proposes an order: your broker adapter is the one that sends it.
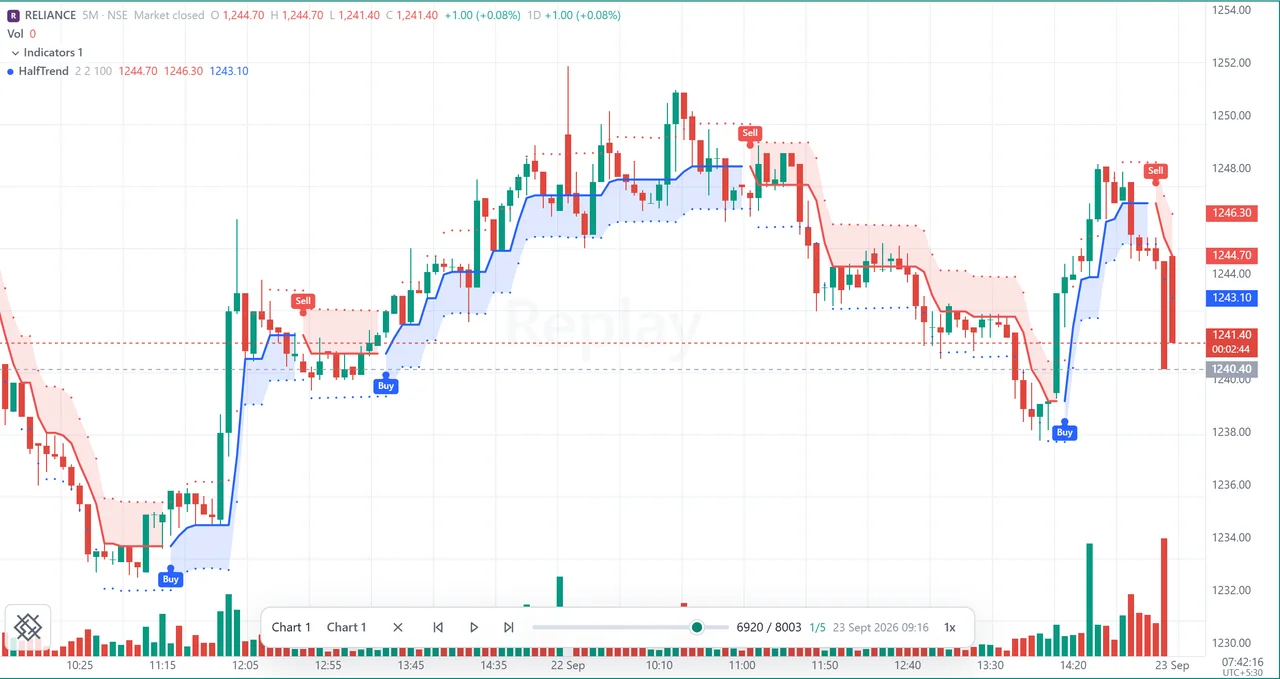
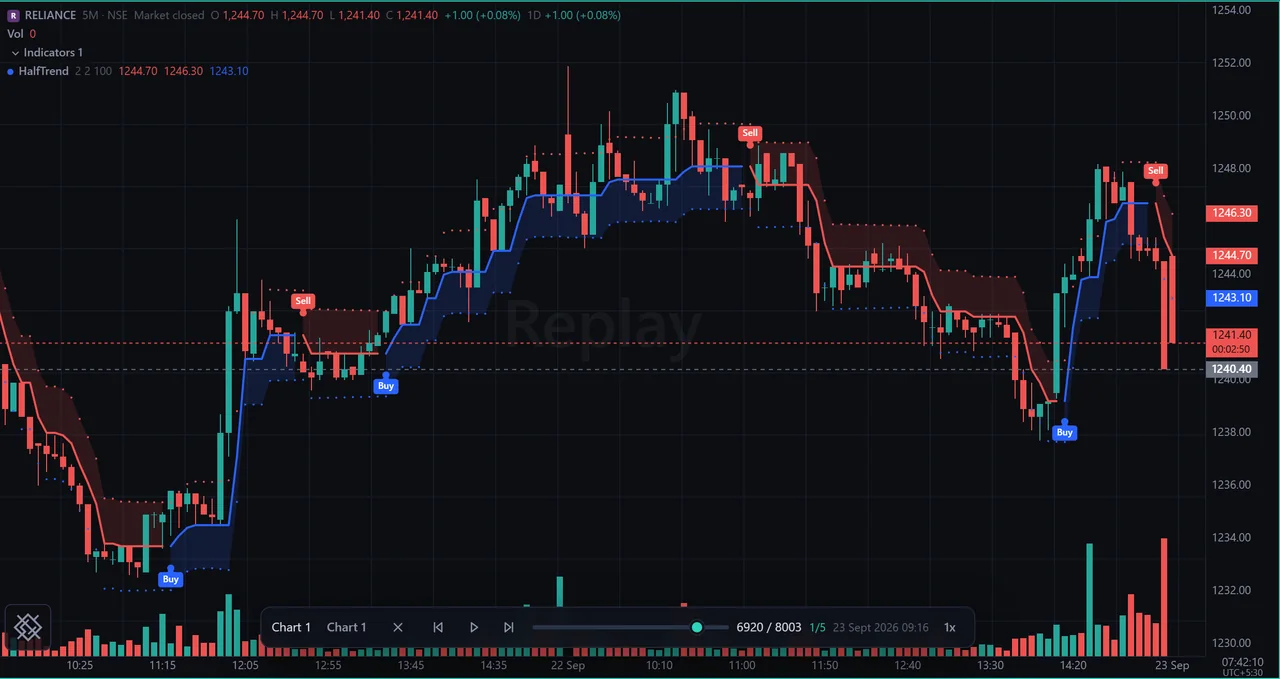
Replay a session, one minute at a time.
Step or play through past sessions and watch each candle form from real one-minute bars, the way it did live.
- The open never moves, the high and low never pass the real candle’s, and the last step lands on the real close.
- Where the source kept no finer history, the candle forms along a path through its own prices, and the replay bar says Simulated.
- Indicators, drawings and alerts replay with the chart.
Write a study once.
Plot it, backtest it, trade it.
OpenScript is an open trading language that runs on this chart. It compiles in the browser with no eval, a compiled program is plain data, and the same program runs on the TypeScript engine in the page and the Python engine on a server. A runaway script stops at its instruction, memory and time budgets.
OpenScript on GitHub, Apache-2.0version 1
study("EMA cross", overlay = true, precision = 2)
fastLen = input(9, "Fast length", min = 1, max = 500)
slowLen = input(21, "Slow length", min = 1, max = 500)
src = input(close, "Source")
fast = ema(src, fastLen)
slow = ema(src, slowLen)
up = crossUp(fast, slow)
down = crossDown(fast, slow)
fastPlot = plot(fast, "Fast", aqua, width = 2)
slowPlot = plot(slow, "Slow", orange, width = 2)
fill(fastPlot, slowPlot, fade(aqua, 90))
if up
signal("BUY")
if down
signal("SELL")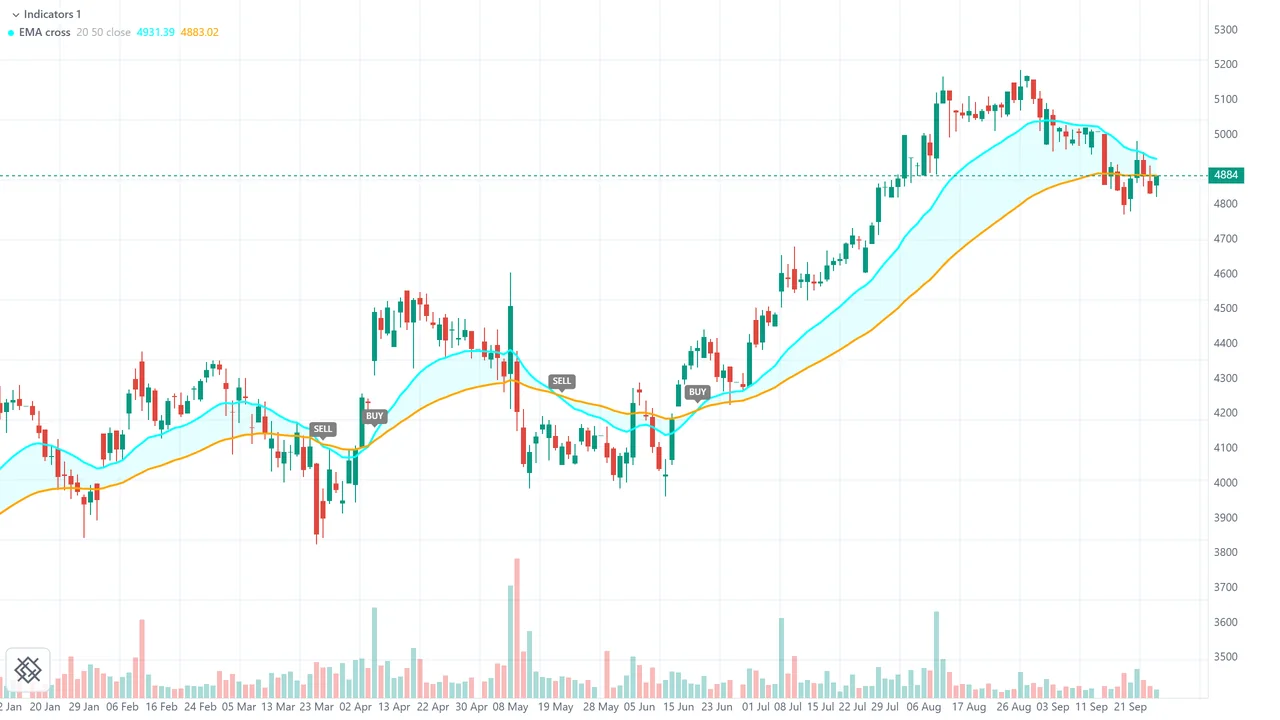
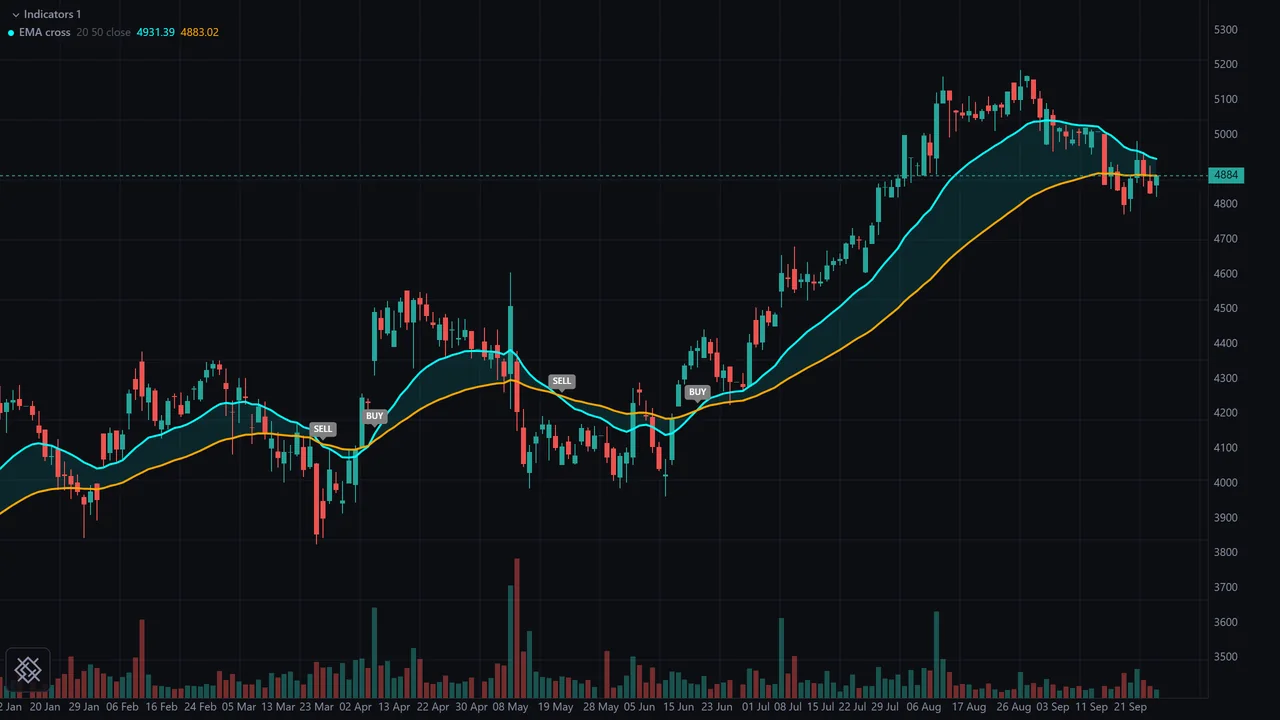
This script, compiled in the page and run on TITAN daily with lengths 20 and 50.
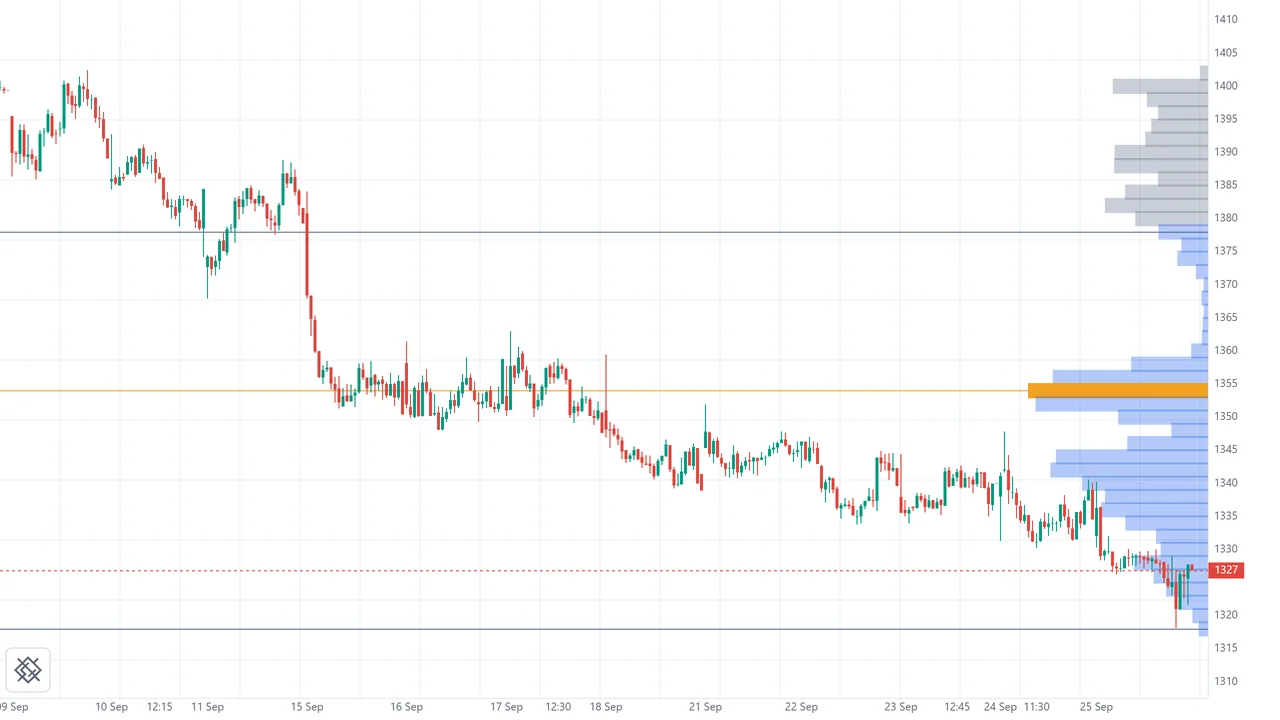
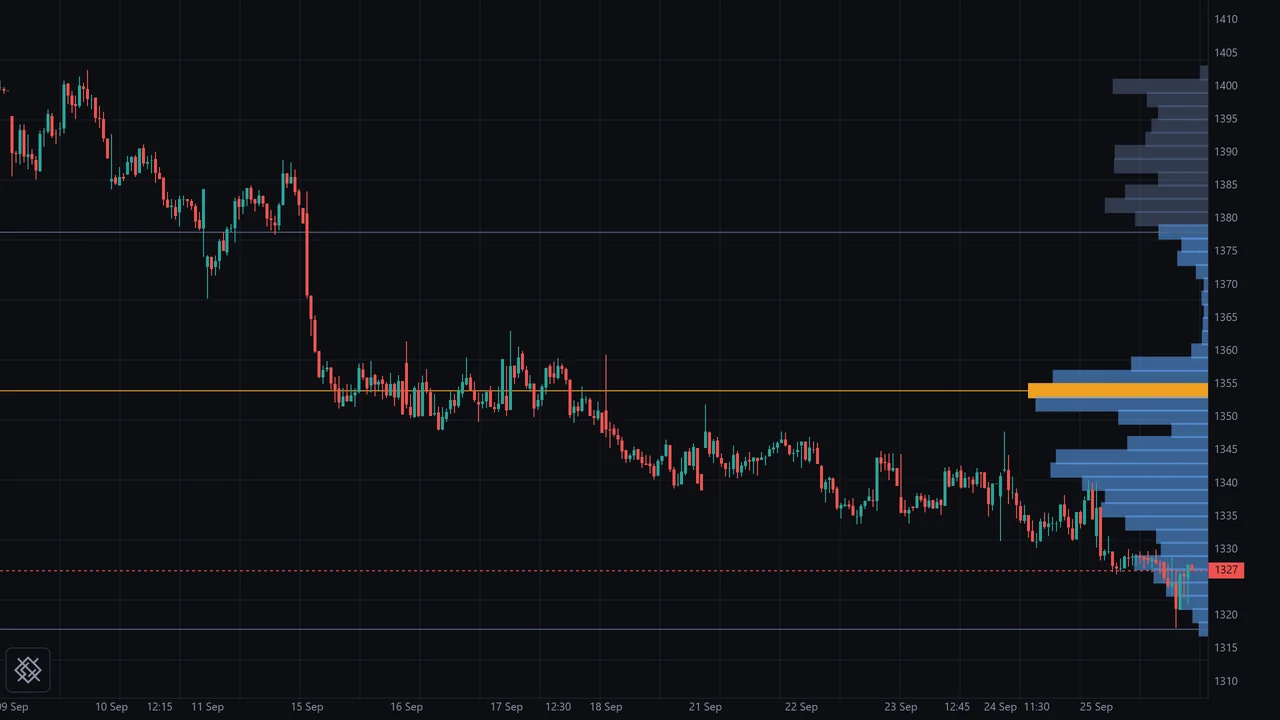
See where the volume traded.
Volume Profile with its point of control and value area, Market Profile letter blocks, Footprint and cumulative delta, drawn inside the chart so they pan, zoom and change theme with it.
Profiles and order flowDrop it into
your stack.
Nine tiers that load only when a screen needs them, no runtime dependencies, and one guide that covers every framework in the same depth.
- 137.53 kB
- the base engine
- 362.48 kB
- a complete terminal
- 0
- runtime dependencies
Sizes are Brotli-compressed, measured for 2.6.0.
Get startedimport { createWidget } from 'openalgo-charts/widget';
import 'openalgo-charts/indicators';
import { OpenAlgoDataFeed } from 'openalgo-charts';
const widget = createWidget('#terminal', {
feed: new OpenAlgoDataFeed({ baseUrl, apiKey }),
symbol: 'RELIANCE', exchange: 'NSE',
interval: '5m', theme: 'light',
onOrder: (order) => broker.place(order),
});The widget never sends an order itself: onOrder hands each one to your code.
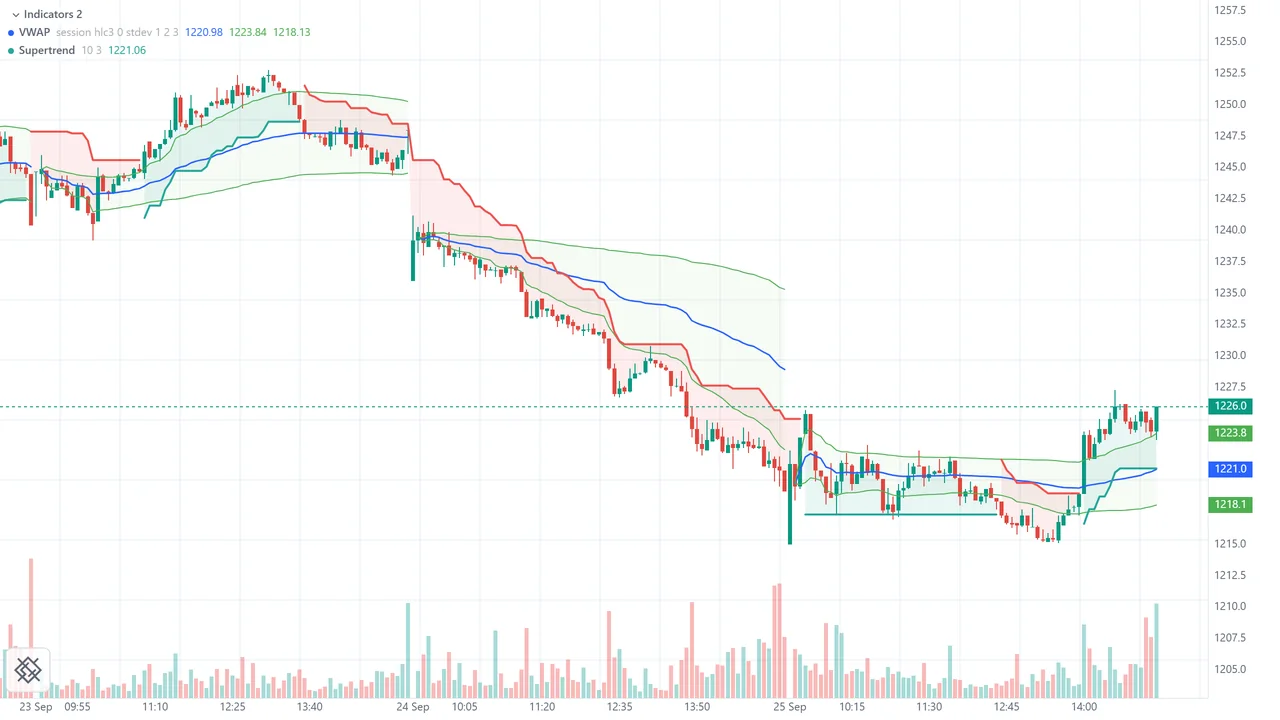
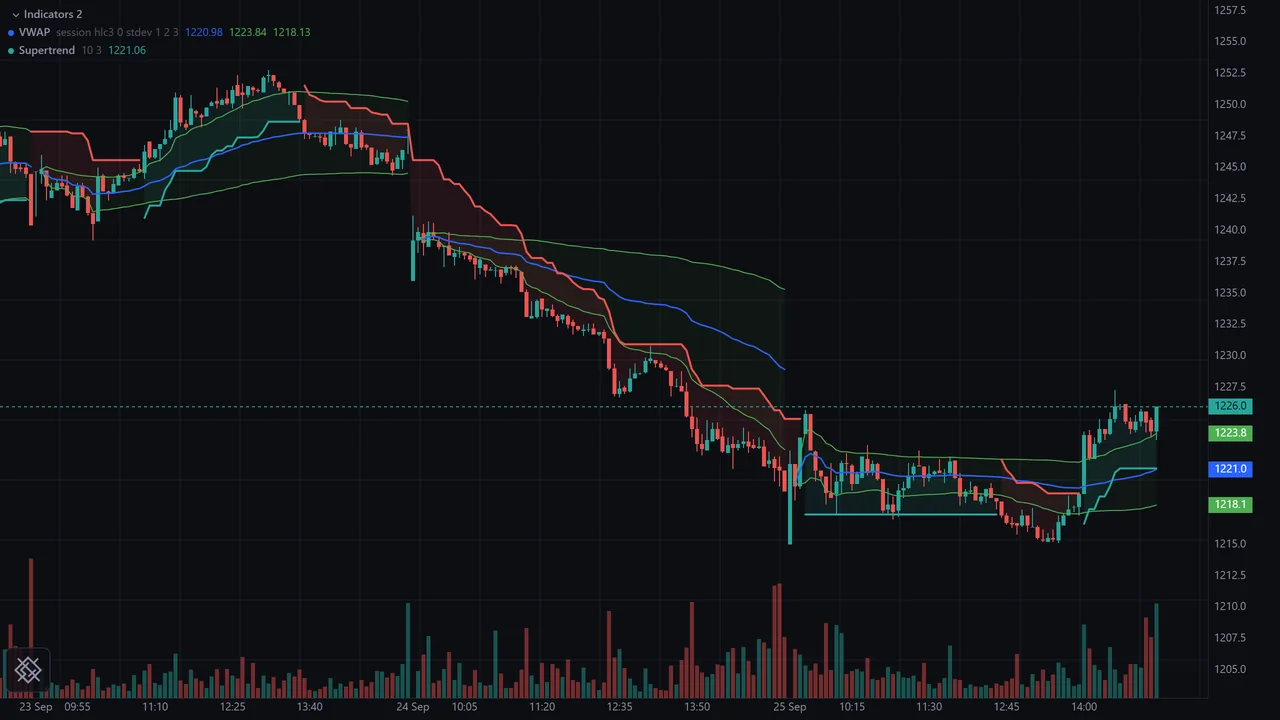
Fast on deep history.
95th percentile frame times on 200,000 bars with Canvas 2D, from the 2.6.0 release bench.
Indian defaults. Your brand.
- IST by default, and any IANA timezone when you need another.
- Intraday candles on the NSE session grid, anchored to the 09:15 open.
- Price-dependent tick sizes for orders, alerts and dragged lines.
- History, live ticks and orders through OpenAlgo’s 36 broker plugins.
- Light and dark themes, every colour configurable, and your own logo.
Made to be
made your own.
Your style. Your workflow. Your next big idea. OpenAlgo Charts gives you the freedom to create a charting experience that feels entirely yours.
See what’s possibleEvery detail, considered.
Thoughtful tools, fluid interaction, and room to focus on what matters to you.
At home in your world.
Light or dark. A single chart or a complete workspace. Shape it around the way you work.
Open from the start.
Free to use, explore, and extend. Built in the open, for a community that keeps moving.
What will you see next?
Your next perspective is a click away.